1FEY2 trade ideas

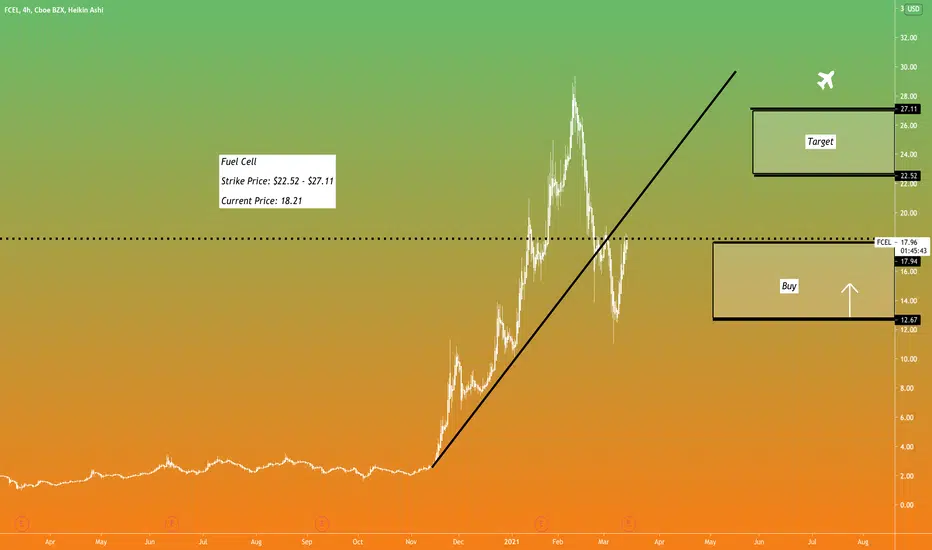
FCEL Q1 2021 earnings resultsFuelcell Energy (FCEL) reported a 1st Quarter January 2021 loss of $0.06 per share on revenue of $14.9 million. The consensus estimate was a loss of $0.04 per share on revenue of $22.1 million. Revenue fell 8.5% compared to the same quarter a year ago. Fuelcell Energy Inc is an integrated fuel cell company. The Company designs, manufactures, sells, installs, operates and services ultra-clean, highly efficient stationary fuel cell power plants for distributed power generation. After it's earnings miss sell off, FCEL bounced off the red 377ema on the 4hr chart, quarterly view.
breakout = $21.09
R3 = $20.29
R2 = $19.42
R1 = $18.45
pivot = $17.57
S1 = $16.58
S2 = $15.81
S3 = $14.93
breakdown = $14.14
Do your own due diligence, your risk is 100% your responsibility. You win some or you learn some. Consider being charitable with some of your profit to help humankind. Small incremental steps work : If you double a penny a day for a month it = $5,368,709. Good luck and happy trading friends...
*3x lucky 7s of trading*
7pt Trading compass:
Price action, entry/exit
Volume average/direction
Trend, patterns, momentum
Newsworthy current events
Revenue
Earnings
Balance sheet
7 Common mistakes:
+5% portfolio trades, risk management
Beware of analysts motives
Emotions & Opinions
FOMO : bad timing
Lack of planning & discipline
Forgetting restraint
Obdurate repetitive errors, no adaptation
7 Important tools:
Trading View app!, Brokerage UI
Accurate indicators & settings
Wide screen monitor/s
Trading log (pencil & graph paper)
Big organized desk
Reading books, playing chess
Sorted watch-list
Checkout my indicators:
Fibonacci VIP - volume
Fibonacci MA7 - price
pi RSI - trend momentum
TTC - trend channel
AlertiT - notification
www.tradingview.com


ADDED $FCEL Target 24.13 for 28.90% Or next add level at 13.31 $FCEL Target 24.13 for 28.90%
Or next add level at 13.31
FCEL dipped enough for me to add a little here at 16.06...
I am not your financial advisor. Watch my setups first before you jump in… My trade set ups work very well and they are for my personal reference and if you decide to trade them you do so at your own risk. I will gladly answer questions to the best of my knowledge but ultimately the risk is on you. I will update targets as needed.
GL and happy trading.

Longterm short crossing below 50EMA with the poor earning report! make a clear bearish case for FCEL

FuelCell - FCEL - Still looking bullish?Fuel Cell - FCEL - Still looking bullish? Not financial advice


PROBABLE LONG ENTRY - FUELCELL ENERGY - FCEL - 30MNThank you for your likes and shares. I really appreciate!
_________________________________________________________
After a long run down the FCEL in short time frame is probably preparing to recover.
See the latest candlestick showing a very strong squeeze of sellers. This won't prevent the market to go down further. But, in probability, when this even occur with such a high volume, the market tends to go in the opposite direction afterward.
For long time investors, this could be a nice placement knowing how the sector energy want to improve and evolve by introducing slowly hydrogen to the current world. Specially with the increase of space projects interested in the "clean" hydrogen applications.

Long on $FCELFcel may rally again. Long Pt 30$+.
FCEL will try to go back to the old trendline.
I would love your opinions on this.
PS I am not a financial advisor.

Another bubble is about to burst in next week!FCEL is about to experience a huge down gap after its earnings next week. Almost no fundamental analysis supports a 5.6 Billion market cap for a company with a 17 million revenue/quarter. Forecast to become profitable in the next 3 years!
1- Almost 22000% gain in 20 months for a company without any significant change in revenue and EPS.
2-Similar price correlation with SFIX. SFIX experience a 28% down gap after earning calls. correlation study between these two shows a bigger bubble in FCEL.
I believe FCEL makes a perfect case for a huge down gap after earning cal. it is better to insure your stocks with put options
please read my analysis on November 19, 2020, for FCEL with the title of do you believe in HYPE? I put its target at 29.88 when it was just 5.36..! FCEL touched 29.44 on 10 Feb 2021, then experienced a drop to 11.07.
please be mindful of the risk involved in options trading if you want to buy puts!
Moshkelgosha

Fuel CellLooking for price to hit the 20's by next week. Price is currently testing resistance and should consolidate upwards.
What do you think?
Like, Follow, Agree, Disagree!
FCEL LONG Bullish3/10/21 in a new regression channel. looking for it to retest the .786 fib that it rejected previously on 3/2/21 still bullish as this should move back up with Biden energy catalyst.

$FCEL Target 24.47 for 28.38% $FCEL Target 24.47 for 28.38%
Or next add at 13.65
I am not your financial advisor. My trade set ups work very well and they are for my personal reference and if you decide to trade them you do so at your own risk.
GL

FCEL- Watch for BreakoutFCEL shares found support recently, completing the descending breakout wedge they were forming. Watch for a breakout in the next week or two. Stop loss at $12. You may want to wait until after earnings, but this is a really good potential breakout play regardless. Like and follow for more ideas like this :) Good Luck!


FuelCell - possible breakout ahead - finallytook a litte longer.. but the formation looks good and if this week the US Yields stay lover or fall .. good for the stock market... so RSI is low, MACD is turning around... mid of the year could reach the goal of 29.50

FCEL LongI have been following this for the the past year included old material for comparison
big up for the support & resistance script thankyou again

FCEL LONGlooking for FCEL to retest the EMAS right above it. Sitting right below the 236 fib from the previous run up back in Jan. With Bidens energy plans should be a catalyst for this stock to run back up.

FCEL: A new Key Point that we all must be aware of!Hello traders and investors! Let’s talk about FCEL again! It has been a while since my last analysis about it, so, let’s see how it behaved since then. The link to my last analysis is at the end of this analysis, as usual.
I wrote my first analysis about FCEL when it dropped about 20%, after some news about a public offering, and some people were extremely concerned about it, but since I’m a Price Action trader, and the only thing that interests me is a good Risk/Reward ratio , I thought it was a good idea to invest at FCEL, regardless of how pessimist the sentiment was.
The stock went up from $ 7 to the $ 30, and now, it is at $ 13 again. The thing is, it did a Head and Shoulders chart pattern in the daily chart, but it already hit its target, which is this black line at $ 10.98.
The black line is the most important Key Point to keep in mind in the short/mid-term , and it must not lose it, as it could engage in a real bear trend and seek for lower levels, maybe the $ 6 again.
Let’s see the weekly chart for more clues:
See how crucial is the area where FCEL is right now? It is sitting above the black line, which worked as support and resistance in the past, and it is above the 21 ema, which is another support level in the weekly chart.
If FCEL is about to react, it’ll be soon, but as long as we don’t have any good signs around, I’m not entirely convinced that it’ll keep pushing up. What we need is a good pattern, and an increase in the volume to resume the bull trend . In my view the moment to buy FCEL has passed, and now it is time to manage positions, and watch the key points mentioned. But we might see something interesting around.
Let’s monitor FCEL closely from now on, as it is in a decisive moment! And if you liked this analysis, remember to follow me to keep updated, and please, support this idea with your like!
Thank you very much!

FuelCell is on the verge of a price breakout of over 100% !!!!In recent weeks, the FuelCell stock has corrected very strongly. So now is a good entry point at the 61.8 Fibo or 78.6 Fibo to trade wave 3!
There is a chance of over 100% price gain!!!

