GOOG Weekly Breakdown and neaer future outlook – May 13, 2025Hey traders — this is my latest take on Alphabet Inc. (GOOG) and why it’s on my radar going into June. Yes, i did in fact scoop shares up at the $150 mark a few days ago!
Let’s dive into the key levels and catalysts on deck:
🟩 Support Zone:
We’ve tapped into the $148 level twice — once in September 2024 and again in April 2025 — and both times, it’s held like a brick wall. That’s your major demand zone, and it’s clearly attracting big buyers on each dip.
📈 Resistance Levels:
First resistance is sitting at $166 — we’ve been rejected here multiple times.
Beyond that, the next ceiling is $186, which will take stronger macro tailwinds to crack.
🧠 Catalysts to Watch:
Apple’s WWDC 2025 – June 9–13
Apple is expected to showcase Gemini AI running natively on the next iPhone. Google’s software baked into Apple hardware? That’s bullish synergy and likely to give GOOG some juice. Price could climb into the $175 range on sentiment alone if the rollout impresses.
Trump’s Global Tech Deals
Massive AI and chip exports are being greenlit — including NVIDIA’s $100B chip deals with Saudi Arabia and the UAE. These kinds of global expansions will put a spotlight on American tech giants again, especially those with HUGE infrastructure and AI capabilities like Alphabet .
💭 My Bias:
I’m bullish into WWDC and the broader AI wave — but waiting for a weekly close over $166 to confirm strength. If GOOG can break and hold that, I’m eyeing the move toward $175 and even $186 in a momentum-driven environment.
🚨 Watchlist Action:
Look for a bounce continuation off $148 if there’s a pullback.
Confirmation above $166 could bring swing setups into the $175–186 range.
If WWDC + AI announcements go as expected, expect heavy call flow and institutional inflows.
Peace out and always F the bears and doomsday folk!
#GOOG #Alphabet #GeminiAI #WWDC25 #TechStocks #ThePlotThickens
1GOOG trade ideas

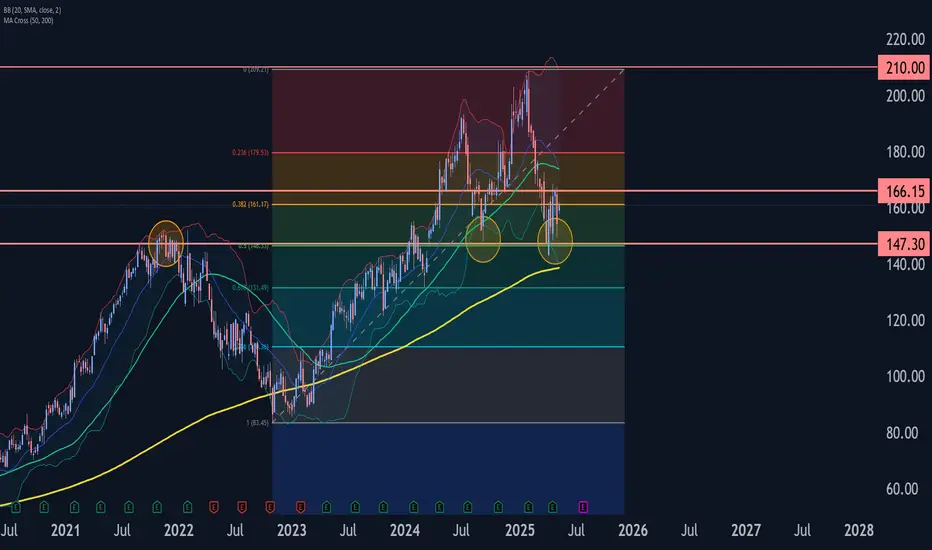
Google Wave Analysis – 13 May 2025
- Google reversed from support area
- Likely to rise to resistance level 166.15
Google recently reversed up from the support area between the key support level 147.30 (which has been reversing the price from July), lower daily Bollinger Band and the 50% Fibonacci correction of the uptrend from the end of 2022.
The price previously formed the 2 weekly Japanese candlesticks reversal patterns Bullish Engulfing near the support level 147.30 – which signalled its strength.
Given the weekly uptrend, Google can be expected to rise to the next resistance level 166.15 (former support from the end of 2024).
Quick View: $GOOGL(daily) EMA21 created a box right below the crossover.
(weekly), good test EMA21-EMA50
Watching $167 as key resistance.
Support → $138/$145

Long $GOOGL, Too much pessimism priced in!- NASDAQ:GOOGL is one of the hated FAANG often get hit in the crossfire of misinformation campaign be it Ads related or Search related.
- NASDAQ:GOOGL is a verb and has lot of things going in favour. Leader in Quantum Computing, Healthy Growth in Cloud Services, Leader in Adtech, De-facto standard for Searches.
- Gemini is a decent LLM and I am seeing diversification of LLMs in the industry.
- Waymo is leader in autonomous vehicles.
- Google has invested in the future like SpaceX which could easily multiply its investment.
Fundamentally,
Year | 2025 | 2026 | 2027 | 2028
EPS | 9.54 | 10.18 | 11.71 | 13.21
EPS% | 18.93% | 6.71% | 15.10% | 12.81%
Base Case (Forward p/e ~ 20 )
Year | 2025 | 2026 | 2027 | 2028
Stock Price | $190 | $203 | $234 | $264
Bear Case ( Forward p/e ~ 15 )
Year | 2025 | 2026 | 2027 | 2028
Stock Price | $143 | $152 | $175 | $198
Bull Case ( Forward p/e ~ 25 )
Year | 2025 | 2026 | 2027 | 2028
Stock Price | $238 | $254 | $292 | $330
Comfortable buying NASDAQ:GOOGL < 160 and targeting $210-220 in 1-1.5 year timeframe.

Google's Hidden Bullish Divergence Could Signal $162 Upside
Current Price: $154.38
Direction: LONG
Targets:
- T1 = $158
- T2 = $162
Stop Levels:
- S1 = $151
- S2 = $149
**Wisdom of Professional Traders:**
This analysis synthesizes insights from thousands of professional traders and market experts, leveraging collective intelligence to identify high-probability trade setups. The wisdom of crowds principle suggests that aggregated market perspectives from experienced professionals often outperform individual forecasts, reducing cognitive biases and highlighting consensus opportunities in Google.
**Key Insights:**
Google, as part of Alphabet Inc., continues to demonstrate resilience in uncertain economic conditions while leveraging its technological dominance to sustain long-term growth. Recent developments in its AI division, particularly through Gemini and Bard, have renewed interest among traders betting on future commercial opportunities in the generative AI sector. Combined with Alphabet’s strength in advertising revenue, cloud services, and YouTube monetization models, the stock's fundamentals remain intact and encourage optimism among industry veterans.
Despite short-term issues, such as concerns over Apple’s rumored AI search engine potentially disrupting their search dominance, Google’s diversification and competitive edge in product ecosystems provide strong upside potential. Analysts highlight Alphabet's undervaluation, reflected in its Price-to-Earnings ratio that is below industry averages, suggesting that market fears might be overstated.
**Recent Performance:**
The stock witnessed bearish sentiment over the past week, sliding from $163 to $152 before recovering slightly to $154.38 as of market close. This 7.5% drop stemmed from market concerns about lost revenue from Apple’s ecosystem, regulatory pressures, and competition in the AI landscape. However, rebounds have been observed as traders increasingly recognize Alphabet’s economic resilience amidst broader technology sector uncertainties.
**Expert Analysis:**
Professional traders and analysts underscore Alphabet’s robust fundamentals, pointing to the nearly doubled margins in its cloud revenue and the sizable market share retained despite recent challenges in its advertising revenue stream. Market observations suggest Alphabet's fair value could approach the $191 mark in the medium-to-long term, providing strategic room for traders looking to take advantage of the current price dip. Analysts believe that Google's diversified portfolio and strong cash flow provide a cushion against industry disruptions, even as AI competition heats up.
**News Impact:**
News circulated last week about Apple potentially developing its AI-powered search engine continues to weigh on the stock. This disruptor would challenge Google's dominance in paid search platforms, where Alphabet gains substantial revenue from its integration into Apple products. However, long-term traders see positive potential in Google’s AI initiatives and collaborations, particularly Gemini and Bard, which have started to penetrate the enterprise sector. Overall, recent announcements regarding AI innovation could alleviate investor concerns and restore confidence going forward.
**Trading Recommendation:**
Given the technical recovery observed in the stock and promising fundamentals suggested by professional traders, taking a long position on Google at $154.38 with near-term targets at $158 and $162 signifies a high-probability setup. While downside risk exists due to competitive and regulatory pressure, stop-loss levels at $151 and $149 mitigate risks and preserve capital. Traders looking to capitalize on Alphabet’s strong recovery potential should consider this setup as an entry into its bullish trajectory.

Alphabet Stock Chart Fibonacci Analysis 050925Trading Idea
1) Find a FIBO slingshot
2) Check FIBO 61.80% level
3) Entry Point > 152/61.80%
Chart time frame: B
A) 15 min(1W-3M)
B) 1 hr(3M-6M)
C) 4 hr(6M-1year)
D) 1 day(1-3years)
Stock progress: C
A) Keep rising over 61.80% resistance
B) 61.80% resistance
C) 61.80% support
D) Hit the bottom
E) Hit the top
Stocks rise as they rise from support and fall from resistance. Our goal is to find a low support point and enter. It can be referred to as buying at the pullback point. The pullback point can be found with a Fibonacci extension of 61.80%. This is a step to find entry level. 1) Find a triangle (Fibonacci Speed Fan Line) that connects the high (resistance) and low (support) points of the stock in progress, where it is continuously expressed as a Slingshot, 2) and create a Fibonacci extension level for the first rising wave from the start point of slingshot pattern.
When the current price goes over 61.80% level , that can be a good entry point, especially if the SMA 100 and 200 curves are gathered together at 61.80%, it is a very good entry point.
As a great help, tradingview provides these Fibonacci speed fan lines and extension levels with ease. So if you use the Fibonacci fan line, the extension level, and the SMA 100/200 curve well, you can find an entry point for the stock market. At least you have to enter at this low point to avoid trading failure, and if you are skilled at entering this low point, with fibonacci6180 technique, your reading skill to chart will be greatly improved.
If you want to do day trading, please set the time frame to 5 minutes or 15 minutes, and you will see many of the low point of rising stocks.
If want to prefer long term range trading, you can set the time frame to 1 hr or 1 day.

GOOGL. UPUPUPStrong Earning, why are we fearing?
As of May 2025, Alphabet Inc. (GOOGL) stock is showing strong potential for growth, according to multiple financial analysts and forecasting platforms:
📈 Current Forecasts and Analyst Sentiment
Average 12-month price target: Around $201.30, with a low of $159 and a high of $2401.
Current price: Approximately $153.36, suggesting a potential upside of 31.26% based on the average target1.
Analyst consensus: Buy, with many analysts rating it as a "Strong Buy"1.
🔮 Long-Term Outlook
According to a detailed long-term forecast, GOOGL could reach:
$217.70 by the end of 2025
$437.86 by 2030
$880.70 by 2035
$1,771.40 by 2040
$7,166.29 by 2050 2
💼 Financial Highlights
Market Cap: ~$1.99 trillion
2024 Revenue: $350.02 billion
2025 Revenue Forecast: $398.26 billion (13.78% growth)
2025 EPS Forecast: $9.08 (12.86% growth from 2024) 1
🧠 Summary
Alphabet is viewed as a strong long-term investment, driven by its leadership in AI, cloud computing, and digital advertising. Short-term forecasts are also optimistic, with most analysts expecting solid gains over the next year.
Would you like a visual chart of GOOGL’s projected growth or help comparing it with other tech stocks like Microsoft or Meta?

GOOGL (Alphabet Inc.) – Medium-Term Position Trade SetupNASDAQ:GOOGL is showing strength as it revisits its previous all-time high, now aligning with the 50% Fibonacci retracement of the current wave. The price action suggests a bullish flip of resistance into support at the $153 zone, with clear signs of buyer defense—offering a compelling medium-term opportunity.
🔹 Entry Zone:
Around $153 (support zone)
🎯 Take Profit Targets:
🥇 $200
🥈 $230
🛑 Stop Loss:
Weekly close below $130

GOOGL SUPPORT AND RESISTANCEGOOGL is trading near the $154.50 level after rejecting the $170 resistance zone, where a sell block (2B) is marked.
There’s a visible gap acting as near-term support around $150.
Below, major buy zones (4B) are aligned at $150–$140, with deeper support at $130, which coincides with the weekly support level.
As long as price holds above the $150 gap, buyers may attempt to regain control.
A break below $150 could push the stock toward the $140 and $130 supports.
#Alphabet #GOOGL #Trading #StockMarket #VolumeProfile #TechnicalAnalysis #Investing #WallStreet
#globaltrade #investment #investing #stockmarket #wealth #realestate #markets #economy #finance #money #forex #trading #price #business #currency #blockchain #crypto #cryptocurrency #airdrop #btc #ethereum #ico #altcoin #cryptonews #Bitcoin #ipo

Alphabet (GOOGL) Shares Drop Over 7% in a Single DayAlphabet (GOOGL) Shares Drop Over 7% in a Single Day
According to the Alphabet (GOOGL) stock chart, yesterday’s main trading session opened around $163.70 but then saw a sharp decline, hitting an intraday low of approximately $148 per share. By the close, bulls managed to recover only a small portion of the losses. As a result, Alphabet (GOOGL) shares fell by more than 7% during the session – marking the worst performance among the S&P 500 constituents (US SPX 500 mini on FXOpen).
Why Did GOOGL Shares Fall?
The drop followed remarks by Eddy Cue, Apple’s Senior Vice President of Internet Software and Services, who:
→ noted a decline in search traffic on Safari;
→ revealed plans to expand Safari’s search capabilities using artificial intelligence.
These developments heightened concerns over Google’s dominance in search and its advertising revenue. According to media reports, analysts are warning of rising competition from AI-powered search platforms such as OpenAI, Grok, and Perplexity.
Technical Analysis of Alphabet (GOOGL) Shares
In our 23 April analysis, we identified a descending price channel and emphasised the psychological significance of the $150 level, which had served as a key support in 2024.
Since then, bulls showed confidence by pushing the price above the red channel. In addition, the chart has begun to outline a potential ascending trend channel (marked in blue).
However, yesterday’s statement from competitors shifts the outlook. The current GOOGL stock price is positioned at the lower boundary of the blue channel – which could act as support, reinforced by the psychological $150 level.
On the other hand, a bearish breakout below this area may revive the downtrend that began in February, potentially paving the way for a test of this year’s lows.
This article represents the opinion of the Companies operating under the FXOpen brand only. It is not to be construed as an offer, solicitation, or recommendation with respect to products and services provided by the Companies operating under the FXOpen brand, nor is it to be considered financial advice.

Google 24 hr potterboxThis is Google with a potterbox and a inverted head and shoulder. I have a good feeling it will hit that mark.$202.61 well lets just wait and see i could be wrong. Happy trading.

GOOGL Weekly Chart Analysis, Google dumping?Google still has a B wave left for correction from Elliot wave perspective,the recent drop also suggest the wave B could be very short. Wave C is the target!!!

Google ShortGoogle is now net short on the regression break.
I am not taking this trade, but it may be the beginning of a new trend and future buy oppertunities.

GOOG Simple Short TradeCRACK!
GOOG has now broken a key area with the potential to have a huge move down.
This is a very simple trade with great risk/reward.
Bulls!! Caution is in order!!

5/7/25 - $googl - Adding it back today at $1505/7/25 :: VROCKSTAR :: NASDAQ:GOOGL
Adding it back today at $150
- i'll leave valuation for another post, except to say (based on the logic below), it's more attractive than the converse.
- aapl news/ testimony saying 'search lower'. okay.
- in my own experience, it did get disintermediated by various ai chats (i use several), but ultimately i'm finding two things 1/ i am spending more time in search, so the pie is growing and that still includes the same amt of time/ searches in google and 2/ google's search has gotten much better w/ the gemini response
- will it be harder to monetize ads? probably yes.
- is the lazy google culture going to be mostly replaced by AI? also yes (hurray!) and nobody seems to want to underwrite this
- so as long as their general digital businesses (must consider maps, email, cloud... many others incl. ai effors, waymo, i could go on) remain not falling apart at the seams, i'd believe their size/ capex budget still puts google as a leading AI-software winner from today
- add to this that most of the biz is digital e.g. no tariff exposed (yes the ads they serve are affected so i get it)
- also no real "china" exposure like say aapl/ nvda etc.
- so ultimately, does it go lower? V says "idk and idc" it's one of these businesses that post last results still delivered. generates cash. valuation reasonable as i mention above (we can get into this in another note later or in the comments)
- but days like today and it's mostly deleveraging. no real money LO is selling this thing in size, the opposite
- so i'm a buyer. necking out w/ some bi weekly calls for notional which allows me to get the "fed" reaction wrong and also benefit from a move higher.
- stock is a buy here
- and thanks aapl. keep talkin'
V
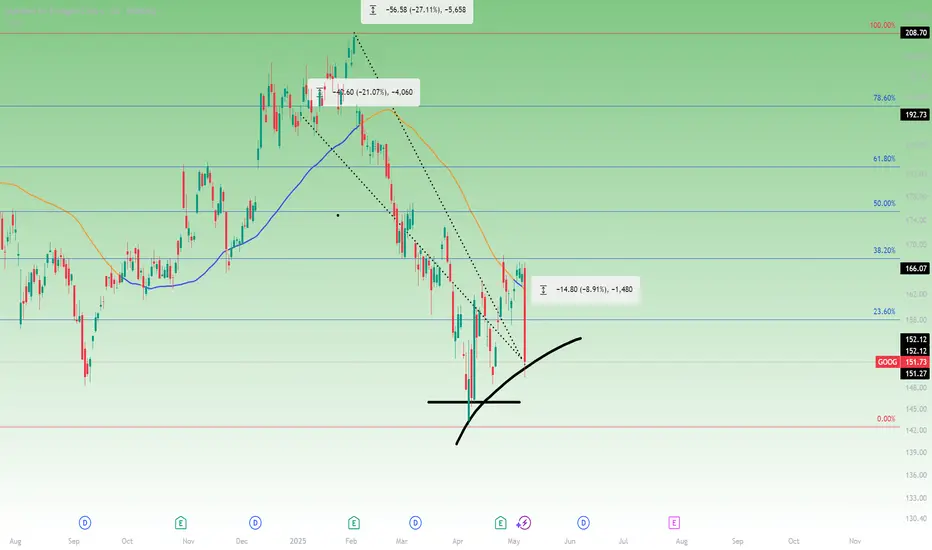
Google in trouble with Apple AI? Watch $146 next?Apple has confirmed it is actively exploring a redesigned web browser across iPhone, iPad, and Mac with a focus on AI-powered search. The potential shift away from Google as the default search provider on iOS devices, poses a direct risk to Alphabet’s search business.
Alphabet shares fell $14.11 (-8.54%) to $151.09 USD on the news, breaking below the 50-day moving average at $162.00 and the 23.6% Fibonacci retracement from the February high and April low, after finding resistance at the 38.2%.
From its February high, Alphabet is now down 27.1%, with a year-to-date loss of 21.1%.
While the stock remains above its 2025 low of $140.53, downside levels to monitor include ~$145.90.
$GOOGL Breakdown – AI Risk Is No Longer "Future Tense"🚨 BREAKING: NASDAQ:AAPL confirms they are exploring AI-powered search within Safari after a decline in browser searches for the first time ever.
💥 NASDAQ:GOOGL is down over 8% intraday, cracking long-term trendline support and decisively below the 200DMA ($173).
📉 The setup is ugly:
Insiders sold post-earnings (again).
Trendline + moving average both lost.
Volume spike and vertical price action = capitulation risk ahead.
🔻 Downside momentum could accelerate if price fails to reclaim $155 quickly.

GOOG Alphabet, Inc. is a holding company, which engages in software, health care, transportation, and other technologies. It operates through the following segments: Google Services, Google Cloud, and Other Bets.

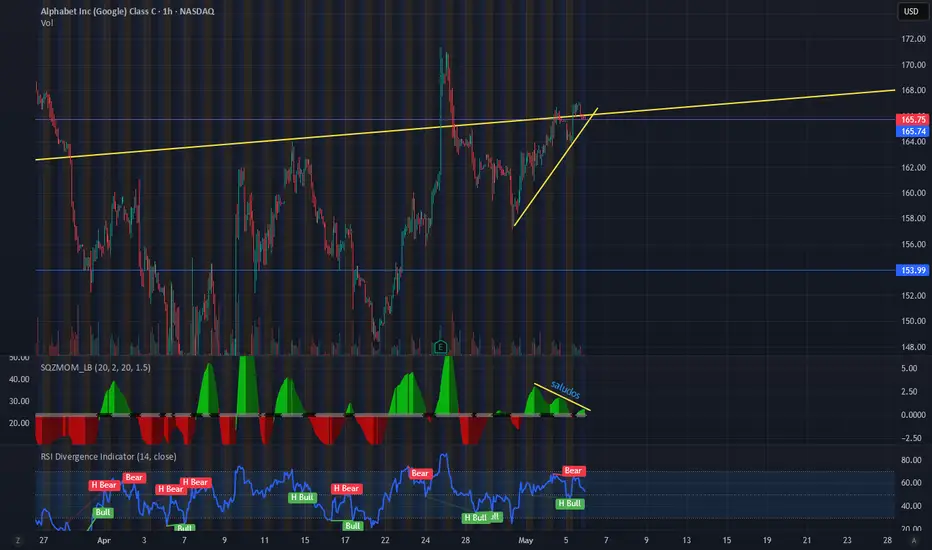
GOOGL Looks Ready to Move — Breakout or Trap?Let’s Talk Strategy 🔍
Alright, here’s what I’m seeing on GOOGL right now based on the charts and GEX data.
🧠 Big Picture (1D Chart)
GOOGL’s been grinding its way out of that falling channel since mid-April, and to be honest, it’s looking decent. It’s hovering right under that key 170.48 zone — a clear resistance from past rejections. The MACD is still positive but starting to flatten, and Stoch RSI looks like it's trying to cool off.
So for the weekly outlook, I’m watching that 170 level closely. If we pop above it with volume, we might get a clean trend continuation toward 177. If we stall or reject, could just be a lower high forming.
⏱️ Intraday Structure (1H Chart)
Zooming into the 1H, price action has been pretty choppy between 162 and 166. It looks like we're basing just under the GEX wall at 167.5–170.
Notice how we keep rejecting around 166? Yeah, that’s no coincidence. There’s a big ol' GEX resistance wall right there.
🧠 GEX Levels & Options Flow
Here’s what’s interesting:
* 🔹 Gamma Wall / Highest Net GEX sits right at 169–170. That’s our ceiling unless some major call flow or IV expansion comes in.
* 🔻 PUT support is solid at 157.5, backed by the HVL level.
* 📊 IVR is low (23.7) and IVX is slightly lower than avg → not expecting explosive moves yet unless we get a macro catalyst.
🛠️ My Thoughts & Trade Ideas
This is one of those “coiling spring” setups. If we push above 170 and hold — I’m interested in long calls, targeting 172.5 or even 177.5 by next week. But I’m not buying the top blindly. I need to see real strength above the gamma wall.
Bullish Idea:
If price clears 167.5 and GEX shifts upward, I’d grab the 170C 5/10 or 5/17, depending on momentum.
Bearish Scenario:
If we reject again at 166–167 and break under 162 with volume, I’d consider puts targeting 157.5, where the support and HVL sit.
✅ Final Take
I like the way GOOGL is shaping up. It’s showing strength but still under pressure from option market makers. I’ll be patient for a breakout — no need to front-run this one. Let the GEX and levels guide the setup.
Let me know how you’re playing this — scalp, swing, or staying out? 👇
This is just my perspective and not financial advice. Trade safe, manage your risk, and stick to your plan.

Google with bearish divergence in 1H and 4HGoogle is showing a bearish divergence in the MACD and RSI. Also, it is now trying to get into the trendline that was used as support for a few years and was lost due to the recent tariff news.
We expect a retracement at least for this week.
Analysts expect this momentum to sustain**Direction:** **LONG**
**LONG Targets:**
- **T1 = $166.5**
- **T2 = $170.0**
**Stop Levels:**
- **S1 = $158.5**
- **S2 = $156.0**
**Wisdom of Professional Traders:**
This analysis synthesizes insights from thousands of professional traders and market experts, leveraging collective intelligence to identify high-probability trade setups. The wisdom of crowds principle suggests that aggregated market perspectives from experienced professionals often outperform individual forecasts, reducing cognitive biases and highlighting consensus opportunities in Google.
**Key Insights:**
Google has recently demonstrated bullish momentum after breaking through key resistance levels at $160, signaling the potential for continued upward movement. Professional analysts expect this momentum to sustain given Google's robust buyback program, its strategic endeavors within AI and cloud computing, and its place within the broader "MAG7" tech grouping. The next resistance at $170 represents a psychological and technical milestone, with strong institutional support evident at current levels.
Additionally, Google's partnership with Nvidia in deploying the DGX cloud platform further strengthens its positioning in enterprise solutions and reinforces its commitment to capitalizing on high-growth opportunities in artificial intelligence. Combined with improving macro sentiment, Google remains well-aligned for upside potential.
**Recent Performance:**
The stock's recovery from earlier consolidation and its reclaiming of the 200-day moving average have confirmed its technical momentum. Google has gained traction in outperforming many of its peers such as Tesla and Meta within MAG7, reflecting increased investor optimism. Professional traders note that the recent breakout above $160 was accompanied by higher-than-average trading volume, signaling sustained buying interest.
**Expert Analysis:**
Experts maintain a broadly positive outlook on GOOG’s near-term trajectory, highlighting its balanced combination of fundamentals and technical improvements. The company’s strategic focus, such as investments in AI and cloud computing alongside its shareholder-friendly buyback program, creates a compelling trading setup. Recent news regarding a partnership with Nvidia’s DGX platform has further solidified expert confidence in the company’s ability to deliver growth-oriented innovations.
**News Impact:**
Recent announcements, including Google's significant share buyback and its Nvidia partnership for cloud computing, have fueled positive sentiment. These developments underscore management's confidence in Google's valuation and its push towards enterprise-driven innovations. Broader trends in tech and AI sectors also enhance Google's prospects, as its strategic moves align well with industries forecasted for strong growth over the next decade.
**Trading Recommendation:**
Given its robust technical and fundamental setup, Google presents a high-probability long opportunity for traders next week. With targets set at $166.5 and $170.0, and stops at $158.5 and $156.0, traders should capitalize on favorable conditions and momentum-driven upside. The rationale combines expectations of continued bullish movement, strong institutional support, and strategic initiatives accelerating future growth.

GOOGL daily resistance test w H&S 15m h&s right on a daily area of interest for GOOGL. price has moved sideways afterwards. new 15m lower close confirmation for puts

Googl at pivotGoogl is at a pivot point here touching historic levels from 2021. The company is a cash flowing machine and FUD has taken control at this point. The market forgets that the company is diversifying away from search as a business. The market forgets about youtube, waymo, and recent wiz acquisition. Stocks bottom on bad news, not good news. I think we see 200$ soon. Double bottom is apparent to me.
