INTU SELL++++INTU testing cloud support of $530 with sell signal $514 bottom of cloud and $509 longer term support which will be tested
1INTU trade ideas

$INTU: Oversold bounce?Growth company Intuit may get an oversold bounce here around the 500-510 area. The extent of it however remains to be seen

Intuit to find buyers at previous resistance?Intuit - 30d expiry - We look to Buy at 507.51 (stop at 491.51)
Price action continues to trade around significant highs.
The primary trend remains bullish.
Short term momentum is bullish.
Previous resistance located at 505.
Previous resistance at 505 now becomes support.
We look to buy dips.
Our profit targets will be 547.51 and 552.51
Resistance: 550.00 / 560.00 / 570.00
Support: 534.60 / 520.00 / 505.00
Please be advised that the information presented on TradingView is provided to Vantage (‘Vantage Global Limited’, ‘we’) by a third-party provider (‘Everest Fortune Group’). Please be reminded that you are solely responsible for the trading decisions on your account. There is a very high degree of risk involved in trading. Any information and/or content is intended entirely for research, educational and informational purposes only and does not constitute investment or consultation advice or investment strategy. The information is not tailored to the investment needs of any specific person and therefore does not involve a consideration of any of the investment objectives, financial situation or needs of any viewer that may receive it. Kindly also note that past performance is not a reliable indicator of future results. Actual results may differ materially from those anticipated in forward-looking or past performance statements. We assume no liability as to the accuracy or completeness of any of the information and/or content provided herein and the Company cannot be held responsible for any omission, mistake nor for any loss or damage including without limitation to any loss of profit which may arise from reliance on any information supplied by Everest Fortune Group

Intuit,,, Buy opportunity As you see this chart is inside a good uptrend and just passed a major price level on daily time frame. In my opinion, this wave is very strong and after touching the top, it again will rise properly. About 475 can be a good price for SL but stop is related to your strategy completely.

INTU - Rising Trend Channel [MID-TERM]🔹Rising trend channel in the medium long term.
🔹In case of a NEGATIVE reaction, the stock has support at approximately 490.
🔹Short-term trading range has been positively signaled by breaking a resistance level.
🔹The RSI is showing a Bearish Divergence against the price, indicating a potential downward reaction.
🔹Technically positive for the medium long term.
Chart Pattern:
🔹DT - Double Top | BEARISH | 🔴
🔹DB - Double Bottom | BULLISH | 🟢
🔹HNS - Head & Shoulder | BEARISH | 🔴
🔹REC - Rectangle | 🔵
🔹iHNS - inverse head & Shoulder | BULLISH | 🟢
Verify it first and believe later.
WavePoint ❤️

INTU Intuit Options Ahead of EarningsAnalyzing the options chain and the chart patterns of INTU Intuit prior to the earnings report this week,
I would consider purchasing the 500usd strike price Calls with
an expiration date of 2023-9-15,
for a premium of approximately $12.80.
If these options prove to be profitable prior to the earnings release, I would sell at least half of them.
Looking forward to read your opinion about it.

Looks Legit...A lot of effort went into this idea...I spent a solid 1 minute working out the future...I think lol.

$INTU with a bullish outlook following its earnings #StocksThe PEAD projected a bullish outlook for NASDAQ:INTU after a negative under reaction following its earnings release placing the stock in drift D with an expected accuracy of 60%.

INTU - Ascending Triangle Build OutMight be upside for INTU after building an ascending triangle for most of the year.
Break above $450ish.

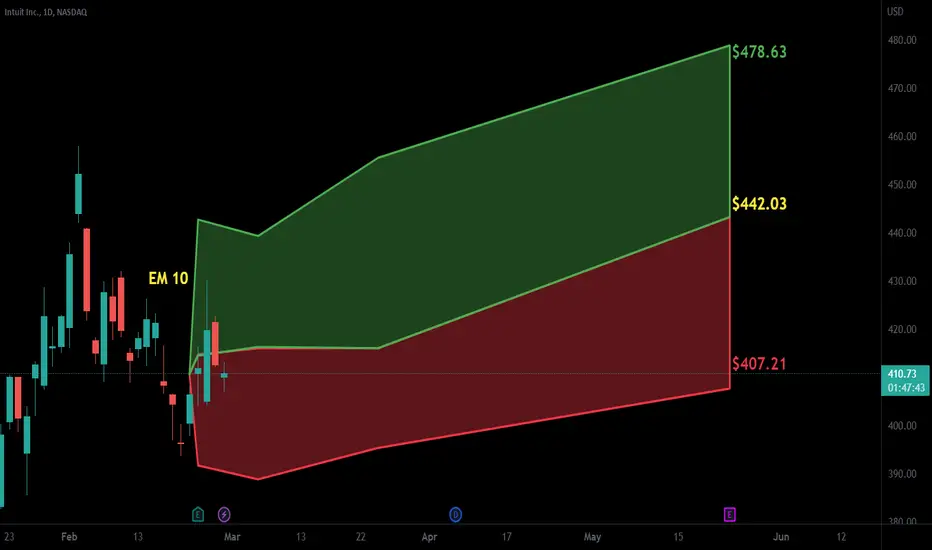
360s by end of June 2023Initial target 410-415 in coming weeks. A break below that will setup for move down to 363 by end of June.
Levels it needs to breakdown on path to target are 397 and 384

$INTU with a bullish outlook following its earnings #StocksThe PEAD projected a bullish outlook for $INTU after a negative over reaction following its earnings release placing the stock in drift C with an expected accuracy of 87.5%.
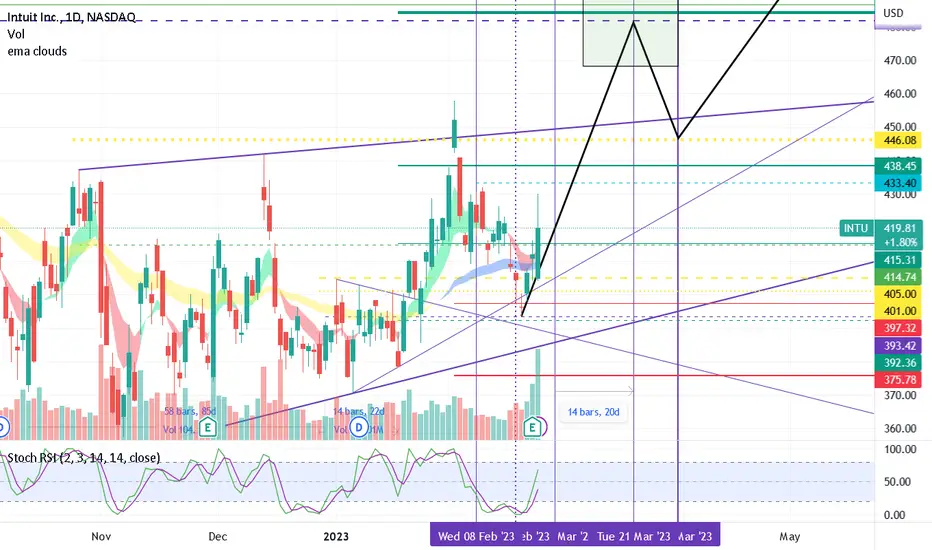
480s by end of MarchINTU saw an SOS after accumulation going into earnings, then the backup retest. On the earnings beat it began its markup and is headed to 480s by end of March.
After 480s it will need to retest 446 for support, if that holds it can continue into the 500s.
INTU to end its consolidation period.INTU beat EPS and REV expectations and the valuation points to higher numbers.
Its business proved resiliency and the outlook doesn`t look so grim. INTU has a good history of EPS growth.
The stock might put an end to the consolidation period and renew its uptrend.
#notfinancialadvise. Adjust your size accordingly.

Intuit: Trust Your Gut 😊After it had started the ongoing descent so confidently at first, Intuit has been struggling in a sidewards movement. Now, the share should trust its gut and decide or rather intuit – pardon the pun! – to continue its journey to the south. We expect the course to drop below the support at $339.36, where it should complete wave B in green at about $303.29 before taking off again. Alternatively, Intuit could have already finished wave alt.B in green and thus climb above the resistance at $457.94 by now. We rate this alternative scenario with a probability of 38%.

Intuit: Skyfall 🪂You better not be afraid of heights, since Intuit is dropping rapidly and we're expecting the course to sink all the way below the $339.36-mark to finish the green wave ideally around the $303.29-mark, before turning the trend back up. In case the stock refuses to sink into a correction and crosses the resistance line at $441.98, our alternative scenario will be activated.

Good breakout.this is a good breakout
Will see if this has followthrough upcoming days to get a feel for whether or not breakouts have followthrough.

$INTU with a Bullish outlook following its earnings #Stocks The PEAD projected a Bullish outlook for $INTU after a Negative over reaction following its earnings release placing the stock in drift C with an expected accuracy of 85.71%.

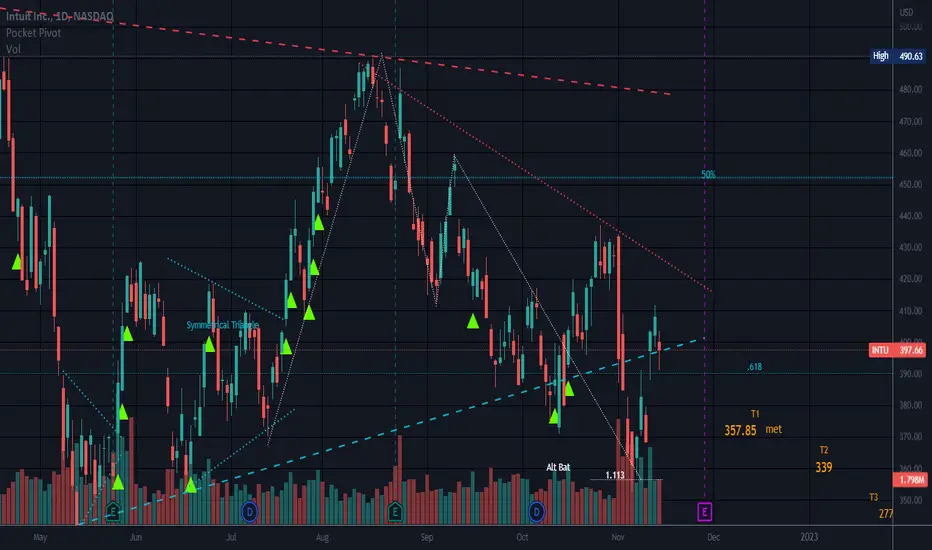
Symmetrical TrianglePrice has recovered from a break of the support line of the large triangle.
It appears to be hanging on to the support line.
Target 1 has been met. Sometimes that is all we can shoot for in the near term.
Alternative Bat/an M pattern noted.
Earnings 11-29 AMC. Projected numbers that are a bit higher than last quarter.
So far analysts have not given INTU an earnings break for this quarter. In some of the other stocks I follow, the numbers have been soft in comparison with last quarter.
No recommendation.
Symmetrical TriangleNeutral pattern until broken with a confirmed trend in that direction.
Prior Ugly Top and price is well below the neckline.
INTU has been below the support line of this triangle and popped back inside.
Struggling today and the daily candle turned from red to green while I was typing this.
Recent Pocket Pivots noted when price gets close or falls below the support line.
The Fed is speaking this afternoon about the interest rate hikes and inflation, so it is tough to figure out how the market will react.
Price is just above the .618 of the trend up.
Targets in green are for a break to the upside and targets below in orange are for a break to the downside. Sometimes we are lucky to shoot for T1 and the other targets kick in if the prior target is passed.
No recommendation.
“Hoping for the best, prepared for the worst, and unsurprised by anything in between.”
― Maya Angelou

$INTU with a Bullish outlook following its earnings #Stocks The PEAD projected a Bullish outlook for $INTU after a Positive over reaction following its earnings release placing the stock in drift B with an expected accuracy of 50%.

Earnings BeatINTU beat earnings as was expected.
Possible issues at the .886 of the W pattern.
This pattern can also go to the 1.113 on occasion.
Both the .886 and the 1.113 are marked.
Possible Bearish Bat/The Alternate Bat can hit the 1.113. but usually has a smaller retracement of the 2nd leg than this one did.
NO recommendation.
Candle right now is a Doji, a candle of indecision so who knows?
I like candles of indecision at a bottom. Not so much at resistance so I will wait and see how this plays out.

INTU: Not so 'into' this stockIntuit
Short Term - We look to Sell at 478.00 (stop at 501.49)
This stock reported earning in line with expectations and reported a share buyback which led to a jump in shares premarket. We look to fade this brief rally.480.00 continues to hold back the bulls. Early optimism is likely to lead to gains although extended attempts higher are expected to fail. Further downside is expected although we prefer to sell into rallies close to the 480.00 level.
Our profit targets will be 421.00 and 400.00
Resistance: 480.00 / 580.00 / 660.00
Support: 420.00 / 340.00 / 280.00
Please be advised that the information presented on TradingView is provided to Vantage (‘Vantage Global Limited’, ‘we’) by a third-party provider (‘Signal Centre’) . Please be reminded that you are solely responsible for the trading decisions on your account. There is a very high degree of risk involved in trading. Any information and/or content is intended entirely for research, educational and informational purposes only and does not constitute investment or consultation advice or investment strategy. The information is not tailored to the investment needs of any specific person and therefore does not involve a consideration of any of the investment objectives, financial situation or needs of any viewer that may receive it. Kindly also note that past performance is not a reliable indicator of future results. Actual results may differ materially from those anticipated in forward-looking or past performance statements. We assume no liability as to the accuracy or completeness of any of the information and/or content provided herein and the Company cannot be held responsible for any omission, mistake nor for any loss or damage including without limitation to any loss of profit which may arise from reliance on any information supplied by Signal Centre.

INTU - Broke out of symmetrical TriangleAfter falling about 52% from it's peak of 714 to a low of 339 on 12 May, INTU began to move sideways for the next 2.5 months, cumulating into a Symmetrical Triangle.
It began to break above this triangle yesterday and today continued on the upward trajectory. The trend is clearly reversing to the upside now and any near term pullback should ideally not fall back into the triangle.
Managed positions with trailing stops on the way up. Expect some resistance as it reaches around 490 - 500 (former support turned resistance).
Disclaimer: Just my 2 cents and not a trade advice. Kindly do your own due diligence and trade according to your own risk tolerance and don't forget that money management is important! Take care and Good Luck!
