Medtronic Breaking Out - 3 Uptrends in PlayBeen monitoring $MDT for a breakout partially due to their Minimed 670g being such a leap in insulin pump tech. Strong sales and should dominate competition until their tech catches up.
Entry at daily REBZ $89.72.
Trends:
Year 6 of 12
Week 4 of 9
Day 2 of 9
Quarterly needs 2 mo without touching the mode to confirm a 12 bar signal.
1MDT trade ideas

MDT Detected possible FDA approval!!!MDT: medtronic inc
2018-07-31 06:15:36
Detected possible FDA approval
$MDT possible C&H with bullish momentum closing candle$MDT possible C&H with bullish momentum closing candle

MDT Detected possible FDA approval!!!MDT: medtronic inc
2018-06-15 08:30:31
Detected possible FDA approval

MDT05/29: Short
- Tweetzer formed at previous swing high.
- Bearish Divergence: RSI and MACD
- Stoch crossed down at range boundary region
- Tempted to test gap around 50%-62.8%


MDT Bullish GartleyBullish Gartley... Price broke through the potential reversal zone, but it looks like we had a hard stop on the downside indicated by the three "almost doji candles". We are also seeing some momentum shift as indicated by the volume weighted MACD. Overall, we could see a little price pop tomorrow and purchasing some March calls would be a perfect play.
Measurments
- .786XA
- 1.618BC
- AB=CD

MDT Detected possible FDA approval this morning!!!MDT: medtronic inc
2018-02-26 08:00:52
Detected possible FDA approval

#MDT #stock #shortMDT has formed an H&S on the hourly chart. Indicators are looking down and so is the trend. Trend is negative all the way up to the daily.
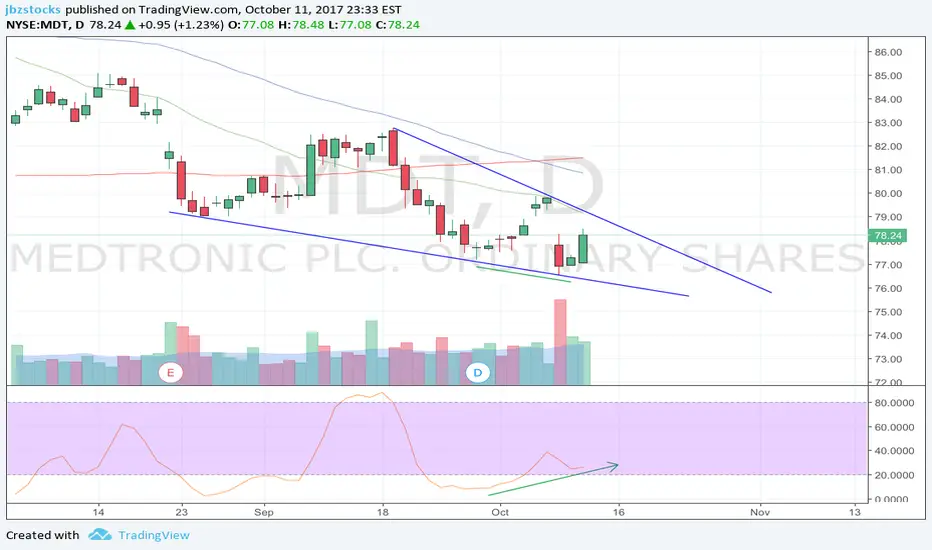
Stochastic divergence at the breakout point of a falling wedgeBuy: 78.25
Target 1: 79.63 - 80.36 (1.76% - 2.70%)
Target 2: 81.56 - 84.68 (4.23% - 8.22%)

MDT IDEA - Ascending triangle waiting for the pullback to the support level of the triangle and then rising to the formation breakout

MDT multiple bottoms with buy divergenceMultiple bottoms with stochastic divergence. Looking for a move up in price before entry at 83.85. Stop is set to 82.75. Looking for a target of 86.00 - 88.00

MDT multiple bottom with buy divergenceMultiple bottoms with stochastic divergence. Looking for a move up in price before entry at 83.85. Stop is set to 82.75. Looking for a target of 86.00 - 88.00.

$MDT positioning for a big breakouthigher time frame is in channel range uptrend looking to breakout strong
mid time frame is showing positive price action- showing higher highs and higher lows along trend line
rising rsi and positive volume pressure-trading above value area showing strong momentum
lower time frame is showing price action showing uptrend with weak correctives moves meaning bulls in control-working way up ascending triangle
trend alignment across the board


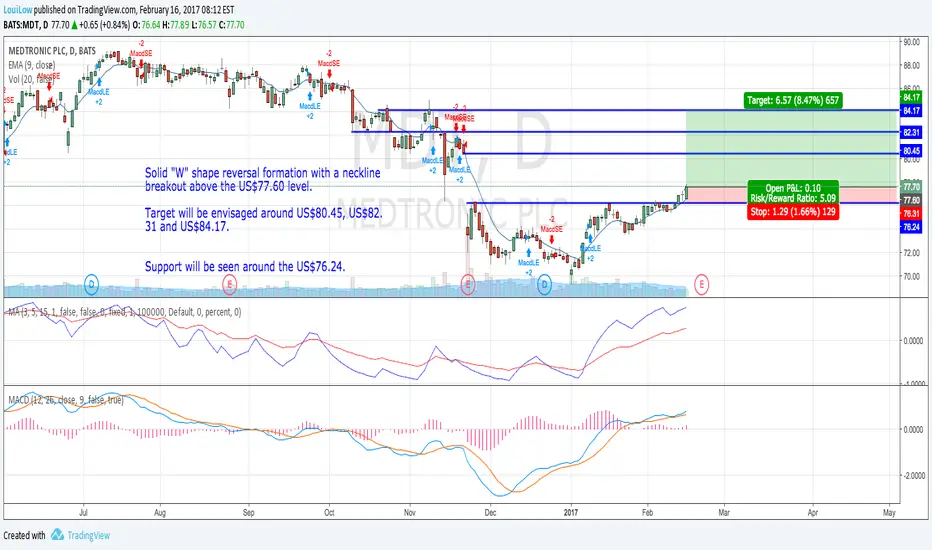
"W" reversal formation with a neckline breakout above US$77.60Target will be envisaged around US$80.45, US$82.31 and US$84.17.
Support will be seen around the US$76.24.
MDT - Buy Jul17 77.5 Puts for Swing DownMDT has a fresh down move that was supported at $72.30. The area of support encompasses previous price action the weekly 200sma. Currently, prices have made the first leg of a 2 leg retracement with a 2nd leg in the $77-$78 price level.
The concern with this trade is the bounce off 200sma and previous support may drive prices beyond the $79.50 level of bull/bear battle. In addition, the downside is limited to the previous support.
However, there is still a solid area for a continuation move down and price action if medical continues to weaken as a sector.
Buy Jul17 Puts @ $4.1 and $3.6.
Good Hunting!

MDT - Buy Jun 77.5 Puts @ $4.1MDT broke down with medical stocks at the end of 2016 and has started to pullback. Prices reached support and the 200sma before retracing. Currently, prices have completed 1 leg up and are looking to complete 2nd leg to the 34EMAL.
The downside of this trade may be limited by previous lows and the 200sma, however, there is still enough room to make $$ if prices form a double bottom.
I'm looking to Buy Jun 77.5 Puts between $77.20 and $78.20 which would put prices between $4.1 and $3.6.
First Profit target = $74.20.

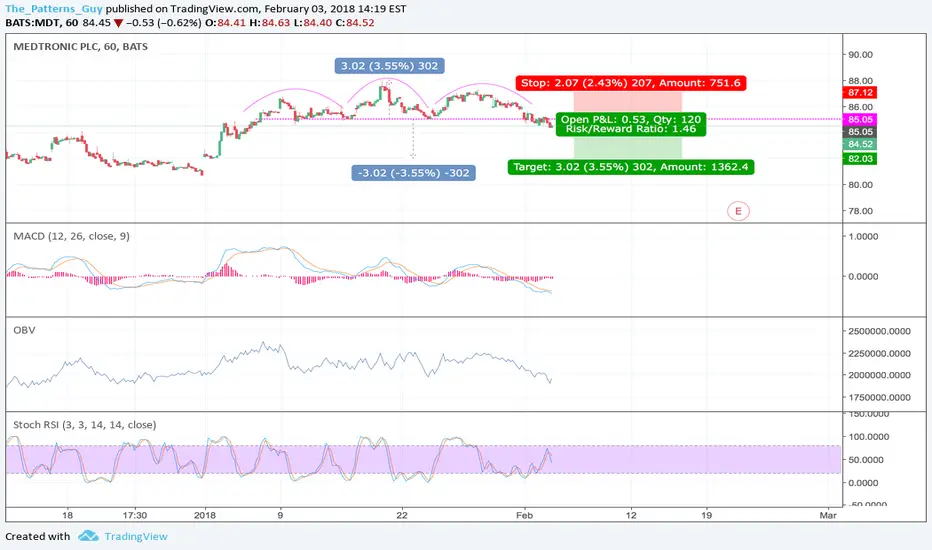
MTD LONGHey there!
Generally speaking, I'm testing my new trading system.
IMHO, it is a great experience to write down all your trades, as it is much easier to analyze them later.
Thus, I'm publishing my ideas here. It will be also great if some of my trades will help all of us to get some profits)
I'm also attaching my risk calculations.
Normally, my risk per trade is 3.5% per trade.
It is much easier for me to trade when I understand what is my risk per position.
P.S. Target area is changing depending on entries (as you could notice I use multiple entries). I'm going to update all the data inculding targets as long as the trade remains opened.
Cheerz!


Taking a Long Shot with MDTHi all,
Here is breakout idea, that will require possibly holding a long position for the longer term.
This is potentially suitable for traders looking to "re-invest" their shorter term trading profits.
1 MDT has been trending extremely well, since June 2013 to Feb 2015.
Over a period of about 33 months, price has channeled upwards, from around $38 to $79 on Feb 2015, returning an impressive 115% gain.
2 Of course nothing lasts forever and we see a consolidation phase, where price retraces aggressively to around 64 (-18%), before trading back to $78 levels on Apr 2016.
Please note that this is not a triangle pattern. To be honest I am not sure what fancy cute name to call this formation.
What I do know that this is a clear consolidation pattern, with a sharp rejection of $64,00, subsequent support buying above $72.00 and price is already trading above the resistance zone.
Projection:
Price is already breaking out an is likely to trade higher.
It is likely that the breakout might repeat the price action in 1, in the form of a slow and steady channel up.
Therefore a long holding period is highly advised in order to capture the full potential of the bullish move.
Entry Condition:
A long entry can be executed now, as long as price is no more than 81.50 and no cheaper than 78.50 and no later than 12 May 2016.
Stop Loss:
Below 78.00.
If price were to trade to the consolidation, then the breakout is no longer valid.
Taking Profit:
Looking at how price behaves in 1 , I will prefer not to assign absolute profit targets and simply let the price run its due course.
In other words, a long holding period is advised, in order to capture a potential steady increase in price trend.
Method 1: Profit can be taken at around $92. which is a simple technical projection from the height of the consolidation zone in 2 .
$100 is also another possible technical level to consider taking profit.
Method 2: Set up trendline as shown, set a alarm to notify you when price breaches the line.
Close the position when the alarm goes off, as it indicates that the trend might be an end.
It might be a long wait so patience is highly advised.
Risk:
Because this is a long term position, there's a risk that new fundamental information, especially earnings releases, may negatively affect the price.
Summary:
MDT has broken out of a 14 month consolidation zone and is looking to trend steadily higher over the long term.
Have a profitable day~
-BreakOutArtist

Medtronic rising to the sky Fundamentals :
It's not every day that you find a solid company operating in a growing industry which also happens to be a dividend aristocrat. Medtronic is such a company. Company is operating in the healthcare industry, being the largest medical technology company in the world. Today before market open company releases tis earnings report.
Technical :
Price broke up and holds above important resistance level $79. Price above all key moving averages.
Trade and Risk management :
Break above $82 will trigger Entry Long with stop below $80.60 and target around $88
