Trailing Stop Line by %This draws a Trailing Stop Line that is n % off the highs - default is 6%. Once the line is hit, it draws an arrow & changes the line yellow. This is useful to see where a broker placed Trailing Stop trade will stop out, when the order is placed using a specified % drawdown in price. It can also be used to see what may be an optimum % to use for a given symbol. This is currently only setup for LONG positions.
Future enhancements will include a line for SHORT positions.
1MRKX trade ideas

Merck's Keytruda Triumphs in Q4 Reports
Merck & Co ( NYSE:MRK ) has emerged victorious in its fourth-quarter performance, exceeding market expectations fueled by the remarkable success of its flagship cancer immunotherapy drug, Keytruda. The pharmaceutical giant reported robust financials, driven by a 21% surge in Keytruda sales, catapulting it to the status of the world's best-selling prescription medicine. This stellar performance not only defied analyst predictions but also positioned Merck ( NYSE:MRK ) as a frontrunner in the pharmaceutical industry.
Keytruda's Stellar Performance:
Keytruda's sales reached an impressive $6.6 billion in Q4, outpacing estimates and contributing to a total annual revenue of $25 billion. The drug's success is attributed to Merck's strategic efforts to expand its usage in earlier stage cancers. Despite its impending patent expiration by the end of the decade, Keytruda remains a formidable asset for Merck ( NYSE:MRK ), overshadowing even the peak sales of AbbVie's blockbuster arthritis drug, Humira.
Strategic Moves to Counter Patent Exclusivity Loss:
Aware of the looming patent exclusivity loss, Merck ( NYSE:MRK ) has proactively engaged in strategic initiatives to mitigate the impact. The pharmaceutical giant recently entered into multiple deals, including a significant $5.5 billion collaboration with Japan's Daiichi Sankyo for the co-development of three promising cancer drugs. These moves signify Merck's commitment to maintaining its competitive edge and market leadership in the evolving pharmaceutical landscape.
Optimistic Outlook and Pipeline Expansion:
Merck ( NYSE:MRK ) has revised its outlook for the mid-2030s, projecting adjusted annual sales for new oncology products to exceed $20 billion, up from the initial estimate of over $10 billion. The company has similarly elevated its mid-2030s forecast for cardiometabolic products to approximately $15 billion, demonstrating confidence in the potential of its diversified portfolio.
Financial Resilience and Restructuring Efforts:
Despite taking a charge of $1.69 a share related to the Daiichi deal, Merck ( NYSE:MRK ) reported adjusted earnings of 3 cents per share in Q4, defying expectations of an 11 cents per share loss. The company's Q4 revenue of $14.6 billion, a 6% increase from estimates, further underscores its financial resilience. Merck has also initiated a restructuring program aimed at optimizing manufacturing operations for both human and animal health, projecting completion by the end of 2031. While this program incurs approximately $4 billion in cumulative pre-tax costs, Merck's proactive stance signals a commitment to long-term operational efficiency.
Conclusion:
Merck's ( NYSE:MRK ) stellar Q4 results, fueled by Keytruda's exceptional sales performance and strategic initiatives, position the company for a decade of resilience in the face of impending challenges. The pharmaceutical giant's optimistic outlook, robust financials, and proactive measures to address patent exclusivity loss underscore its commitment to innovation, strategic partnerships, and sustained growth.


Merck to Acquire Harpoon Therapeutics in $680M DealNavigating the Oncology Frontier with Harpoon Therapeutics Acquisition
In a significant strategic move, pharmaceutical giant Merck & Co. ( NYSE:MRK ) has announced its plans to acquire cancer drugmaker Harpoon Therapeutics Inc. ( NASDAQ:HARP ) in a transformative deal valued at $680 million. The move aims to solidify Merck's leadership position in the highly lucrative oncology space, diversifying its portfolio and positioning itself for sustained growth in the face of potential challenges for its flagship cancer immunotherapy, Keytruda.
The Deal Overview:
Merck's acquisition of Harpoon Therapeutics involves a payment of $23 per share, more than double Harpoon's last closing share price, signaling Merck's strong commitment to the strategic partnership. The deal is currently pending, awaiting approval from Harpoon shareholders, with the expected closure in the first half of 2024.
Keytruda and Beyond:
Merck's pursuit of Harpoon Therapeutics aligns with its broader strategy of seeking new sources of growth. With Keytruda generating a substantial $20.9 billion in 2022, Merck recognizes the importance of expanding its pipeline to maintain a competitive edge. Harpoon's promising early-stage trials and T-cell engager assets present Merck with an opportunity to diversify its oncology offerings and explore new avenues of therapeutic innovation.
Analyst Insights:
Merck's acquisition of Harpoon is a strategic and value-driven move. The early but promising data from Harpoon's T-cell engager assets, coupled with investor interest in similar technologies, positions Merck for potential growth in the oncology market.
Building a Robust Portfolio:
Merck's proactive approach to portfolio expansion is evident in its recent deals, including the acquisition of Daiichi Sankyo Co.'s experimental cancer drugs and the purchase of autoimmune drugmaker Prometheus. These moves showcase Merck's commitment to staying at the forefront of medical innovation and bolstering its position in key therapeutic areas.
Investor Sentiment and Momentum:
As evidenced by the stock's current trading position near the top of its 52-week range and above its 200-day simple moving average, investor sentiment towards Merck is positive.
Conclusion:
Merck's acquisition of Harpoon Therapeutics marks a pivotal moment in the pharmaceutical landscape, where innovation and strategic partnerships are crucial for sustained growth. By expanding its oncology portfolio with cutting-edge technologies, Merck positions itself as a leader in the fight against cancer, ensuring a robust pipeline and securing its role as a key player in the evolving healthcare landscape. As the deal progresses towards closure, investors and industry observers will keenly watch Merck's journey into a new era of therapeutic possibilities.

MRK - Excellent breakoutNYSE:MRK has shown a strong breakout. We see a steady secondary downtrend from May 2023 to early December. Anchoring a VWAP to the May 202 high and another to the October low give us a clear indication of support and resistance. I missed the breakout and retest in early December, as well as the break above the VWAP from the prior high.
Taking a fib retrace from the May high gives us an overhead target between 120-124, which aligns to analyst consensus 12 month price target. Note the fib time zone from the June low and June high has aligned to changes in price action. The next is April 5.

Buy MRK.US - Bullish continuationNYSE:MRK is heading for a stronger upside after it broke out of the 6-month corrective downside channel. Furthermore, Ichimoku displayed a bullish signal. Near-term price target is at 111.96


MRK SELLHi, according to my analysis of mrk stock. The stock looks negative. The stock broke the bottom at the 106 level. It also broke the ascending channel to the upside, as shown in the analysis. These are all indications that the stock is still under pressure from sellers. good luck for everbody

MERCK waves a strong short-term bullish flag.Merck and Company (MRK) is trading within a Channel Down since the May 03 High. Even though the price didn't touch the bottom (Lower Lows trend-line) of the Channel Down, having completed 4 straight green 1D candles indicates that most likely we have seen the new low of this sequence. Assuming the current bullish wave will make at least a +7.10% extension like the previous two, then we are only halfway there, so we still have a solid short-term buy opportunity in our hands.
As the 1D MACD is about to complete a Bullish Cross, the buy entry is validated. Our target is 108.00, still under the 1D MA200 (orange trend-line).
-------------------------------------------------------------------------------
** Please LIKE 👍, FOLLOW ✅, SHARE 🙌 and COMMENT ✍ if you enjoy this idea! Also share your ideas and charts in the comments section below! This is best way to keep it relevant, support us, keep the content here free and allow the idea to reach as many people as possible. **
-------------------------------------------------------------------------------
💸💸💸💸💸💸
👇 👇 👇 👇 👇 👇

MRK going short on dow theoryMRK is forming a consistent LH and LL and hence going short. Furthermore, no divergence hence the downtrend is strong.

Merck vs. the TrendlineMerck has done little all year, but now there could be signs of a breakout.
The first pattern on today’s chart is the falling trendline along the highs of June and July. MRK tried to break that resistance on August 1 after raising guidance. Short-term sellers kept it in check but prices managed to stabilize, and last week they closed above the bearish trendline.
Second, the drug maker made successively higher lows between February and early August. That longer-term support seems to be winning against the short-term resistance.
Next, MACD has turned higher.
Finally, health-care stocks have started outperforming in the last month as the Nasdaq struggles. MRK is also a member of the Dow Jones Industrial Average, which has led recently.
TradeStation has, for decades, advanced the trading industry, providing access to stocks, options, futures and cryptocurrencies. See our Overview for more.
Important Information
TradeStation Securities, Inc., TradeStation Crypto, Inc., and TradeStation Technologies, Inc. are each wholly owned subsidiaries of TradeStation Group, Inc., all operating, and providing products and services, under the TradeStation brand and trademark. TradeStation Crypto, Inc. offers to self-directed investors and traders cryptocurrency brokerage services. It is neither licensed with the SEC or the CFTC nor is it a Member of NFA. When applying for, or purchasing, accounts, subscriptions, products, and services, it is important that you know which company you will be dealing with. Please click here for further important information explaining what this means.
This content is for informational and educational purposes only. This is not a recommendation regarding any investment or investment strategy. Any opinions expressed herein are those of the author and do not represent the views or opinions of TradeStation or any of its affiliates.
Investing involves risks. Past performance, whether actual or indicated by historical tests of strategies, is no guarantee of future performance or success. There is a possibility that you may sustain a loss equal to or greater than your entire investment regardless of which asset class you trade (equities, options, futures, or digital assets); therefore, you should not invest or risk money that you cannot afford to lose. Before trading any asset class, first read the relevant risk disclosure statements on the Important Documents page, found here: www.tradestation.com .

MRK to 132MRK (Merck & Co., Inc.) has been consistently rising in a channel since 2022, even during the 2022 bear market.
Consider entering near the channel’s bottom for a potential profit target around 118.39. A breakout could push it to 132 by year-end.


#MRK Straddle Detected! Notional Value- 1.6M$.Based on our team's research of the options market, we expect buy activity at the support level or sell activity at the resistance.
We do research and find new opportunities every day!
Please feel free to leave any comments you have and like this idea if you agree with us. Any feedback or comments will be read. We appreciate it all!

$MRK with a bullish outlook following its earnings #StocksThe PEAD projected a bullish outlook for NYSE:MRK after a positive under reaction following its earnings release placing the stock in drift A with an expected accuracy of 77.78%.

Merck: Water slide 🛝The pool-season is about to start, and Merck has already secured its place on the water slide, which should take it further downwards below the support at $110.66. However, there is still a 35% chance that the share might catch a bubbling fountain which could push it above the resistance at $119.65. In that case, we would expect Merck to develop a new top in the form of wave alt.B in green in the green zone between $119.87 and $123.79 first before turning downwards again.

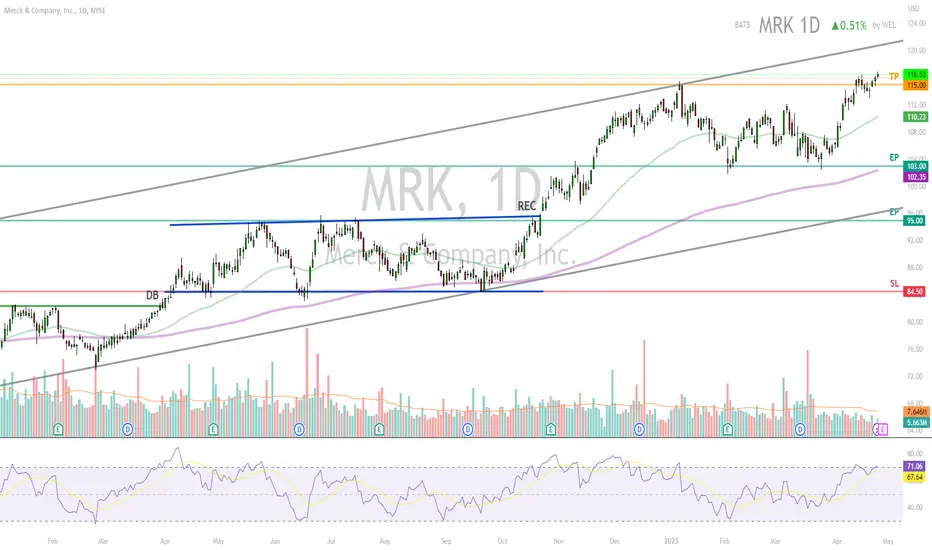
MRK - Rising Trend Channel [MID TERM]- MRK is in a rising trend channel in the medium long term.
- The price has risen strongly since the positive signal from the rectangle formation at the break through resistance at 95.58.
- The stock has broken up through resistance at 115.
- Volume tops and volume bottoms correspond badly with tops and bottoms in the price.
- The short term momentum of the stock is strongly positive, with RSI above 70.
- This indicates increasing optimism among investors and further price increase for MRK. However, particularly for big stocks, high RSI may be a sign that the stock is overbought and that there is a chance of a reaction downwards.
- Overall assessed as technically positive for the medium long term.
*EP: Enter Price, SL: Support, TP: Take Profit, CL: Cut Loss, TF: Time Frame, RST: Resistance, RTS: Resistance to be Support LT TP: Long Term Target Price
*Chart Pattern:
DT - Double Top | BEARISH | RED
DB - Double Bottom | BULLISH | GREEN
HNS - Head & Shoulder | BEARISH | RED
REC - Rectangle | BLUE
iHNS - inverse head & Shoulder | BULLISH | GREEN
Verify it first and believe later.
WavePoint ❤️
$MRK UndervaluedHigh Quality and Undervalued NYSE:MRK
These eight indicators are all Bullish.
If you owned NYSE:MRK for the last 5 years, then you have doubled your investment.
There is no guarantee of the future but it looks like the near future target price is $121
Earnings Date: 27th April 2023
On-balance volume (OBV): Bullish
Accumulation/distribution line: Bullish
Average directional index (ADX): Bullish
Aroon oscillator: Bullish
Moving average convergence divergence (MACD): Bullish
Relative strength index (RSI): Bullish
Stochastic oscillator: Bullish
Trend based on moving average crossover strategy: Bullish

Merck Could Be Breaking OutMerck surged in late 2022 and consolidated during the first quarter. Now the drug maker could be breaking out.
The first pattern on today’s chart is the rally between mid-October and early January, which included a breakout to new record highs. MRK then pulled back and retraced almost exactly half the move by early February. It bounced a little before making a slightly higher monthly low in late March.
Second, MACD was rising in October before the previous surge. Notice how it’s climbing in a similar way now.
Next is the 100-day simple moving average (SMA). The stock rallied from it in October -- also resembling the current price action.
Finally, in the shorter term you have the March 7 high of $112.18. Consider how MRK briefly paused at that level in the last two weeks before proceeding to new record territory on Thursday.
TradeStation has, for decades, advanced the trading industry, providing access to stocks, options, futures and cryptocurrencies. See our Overview for more.
Important Information
TradeStation Securities, Inc., TradeStation Crypto, Inc., and TradeStation Technologies, Inc. are each wholly owned subsidiaries of TradeStation Group, Inc., all operating, and providing products and services, under the TradeStation brand and trademark. TradeStation Crypto, Inc. offers to self-directed investors and traders cryptocurrency brokerage services. It is neither licensed with the SEC or the CFTC nor is it a Member of NFA. When applying for, or purchasing, accounts, subscriptions, products, and services, it is important that you know which company you will be dealing with. Please click here for further important information explaining what this means.
This content is for informational and educational purposes only. This is not a recommendation regarding any investment or investment strategy. Any opinions expressed herein are those of the author and do not represent the views or opinions of TradeStation or any of its affiliates.
Investing involves risks. Past performance, whether actual or indicated by historical tests of strategies, is no guarantee of future performance or success. There is a possibility that you may sustain a loss equal to or greater than your entire investment regardless of which asset class you trade (equities, options, futures, or digital assets); therefore, you should not invest or risk money that you cannot afford to lose. Before trading any asset class, first read the relevant risk disclosure statements on the Important Documents page, found here: www.tradestation.com .

long position on MRKMy strtegy is based on price action with the reading of certain indicators that I like whilerespecting all the values that define the stock maket

MRK ShortToday MRK broke 50 SMA while can not hold resistance at 109. I think the downtrend for this underlying will continue. as it happens the price of MRK could test the 103s level

long position on MRKMy strategy is based on price action with the reading of certain indicators that I like while respecting all the values that define the stock maket

long position on MRKMy strategy is based on price action with the reading of certain indicators that I like while respecting all the values that define the stock maket
