MSTR 10x From HereThis fractal compares the current price action of MSTR to its price action in 2021, during the previous Bitcoin bull market. This time, it is moving slower, so the time interval was adjusted to 1 week instead of 1 day. The next base consolidation target is around December 2024, with a top expected around April-June 2025.
1MSTR trade ideas

Buy if it's Hold 395Double bottom with SMA 10,20,50 acts as support... needs bitcoin to push higher so this name start moving higher

MSTRMSTR after looking above and failing in the attempt to test the highs it has been consolidating for a period of time and is show some signs of strength. If BTC can get a nice push above all time highs I believe you will see ATHs on MSTR.
MSTR Bulls Reload on BTC ConvictionMSTR – Institutional Flow + BTC Correlation + Bull Vertical Spread Setup
MicroStrategy (MSTR), operating as “Strategy,” just went full throttle—adding 10,100 BTC between June 9–15 at an average of $104,080 per coin, totaling over $1.05B. With this, they now hold 592,100 BTC (>$63B), solidifying their status as the largest Bitcoin-holding public company. That’s a bold move amid the ongoing Israel-Iran macro uncertainty, signaling confidence, not caution.
This latest BTC buy was funded via STRK and STRF ATM offerings and the $979.7M STRD preferred IPO. Since initiating their Bitcoin treasury strategy in 2020, MSTR has soared over 3,000%, and they’re projecting a 25% BTC yield for 2025 after already clocking in at 13.7% YTD.
🔎 Flow Watch
Institutional activity around current price levels has been sharp—confirming conviction behind the recent momentum. With BTC hovering at critical support, I’m eyeing a potential short-term bullish reversal. Given the tight correlation between BTC and MSTR, the setup looks primed.
🎯 My Strategy
I’m targeting a bull vertical spread—buying the 382.5 call and selling the 385 call. This defined-risk, limited-reward setup positions me to capture near-term upside if BTC begins a rebound and MSTR follows suit. The tight strike range and elevated IV make it ideal for a premium-efficient directional bet.

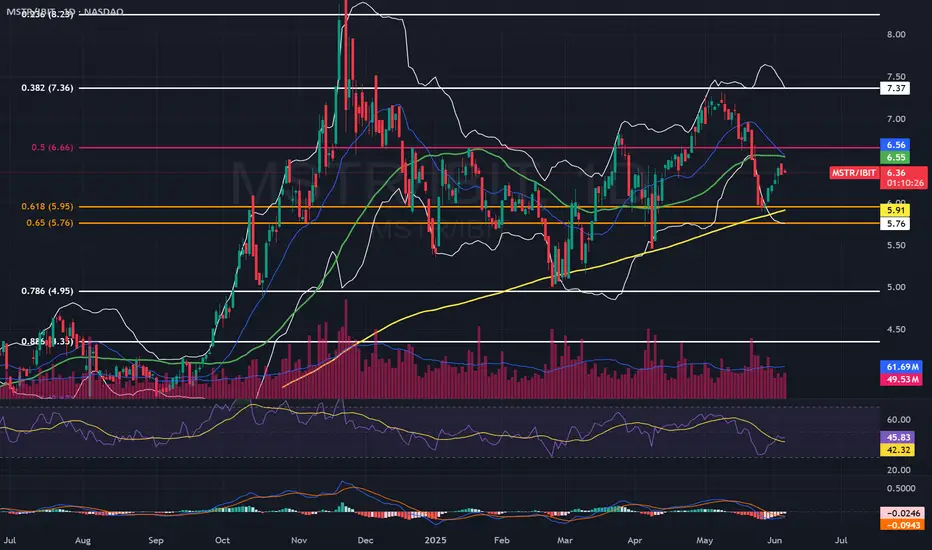
Strategy in SatoshiLooks like MSTR/BTC is being supported by the moving averages, as volatility drops under the all-time descending overhead. What this means is that once the overhead is breached, then MSTR starts to move more than BTC. You start to get days where MSTR moves 3x BTC, and 4x. What MSTU does, only the few and the proud know. It's not for you to know. You are too smart to hold long term an asset which is not intended to be held overnight. Only a fool would do it, or a crazy person, or a very shrewd person with a long time horizon and a middle finger to the taxman.

Bullish flag on $mstr, consolidating under supply tooNASDAQ:MSTR is in a flagpole position, a bullish one. The measured move target would be $700
Do you agree that MSTR is in a bullish stance?
I guess this really come down to how bitcoin does.

MicroStrategy another pull back before all time high?NASDAQ:MSTR analysis update..
📉 𝙇𝙤𝙣𝙜 𝙩𝙚𝙧𝙢 The weekly R5 pivot target is bold at $1500 but definitely possible as a max greed scenario when the triple tailwind of Bitcoin, SPY and Bitcoin treasury companies trends return.
📉 𝙎𝙝𝙤𝙧𝙩 𝙩𝙚𝙧𝙢 retracement is expected to end around the S1 pivot at $341 and a secondary target of $321.
Irans conflict has investors shaken and not willing to hold assets over the weekend on the fear of worse. However, if the conflict is resolved soon investors could have a great buying opportunity.
𝙏𝙚𝙘𝙝𝙣𝙞𝙘𝙖𝙡 𝘼𝙣𝙖𝙡𝙮𝙨𝙞𝙨
Price appears to have completed wave (B) of an ABC correction in wave 4. Wave C is underway with an expected thrust down (such is the nature of wave C) towards the daily S1 pivot $341. This is also the 0.382 Fibonacci retracement, a high probability area for wave 4 to end. A deeper correction will bring up a triple shield of the High Volume Node, ascending daily 200EMA and 0.5 fibonacci retracement at £321.
Daily DEMA has death crossed.
Safe trading

Could Microstrategy be a 1 Trillion dollar mcap company?!Microstrategy and Michael Saylor evoke a spectrum of opinions, with analysts offering a diverse range of potential future valuations.
High risk, high reward!
The destiny of Microstrategy’s market capitalization is clearly linked to Bitcoin’s performance. The company has been utilizing debt to acquire the cryptocurrency, aiming to create significant spreads. This leverage is the reason why the stock has significantly outperformed Bitcoin throughout 2024.
I am confident that Bitcoin can indeed reach $200k, with a potential upper price target of $250K for this cycle, indicating a potentially explosive Q3 and Q4.
The lingering question is how much additional FOMO and premium Saylor can cultivate for his leveraged vehicle in such an environment?
That's why charting is such a key component to any personal investing strategy IMHO, as we navigate these markets.
MSTR - EWAVESThis analysis of MicroStrategy (MSTR) is rooted purely in the principles of Elliott Wave Theory. We are closely monitoring both the inner and outer wave degrees to identify the ongoing structure, potential reversals, and continuation patterns. The goal is to map the impulsive and corrective phases across multiple timeframes, giving a high-probability roadmap of price action. This approach helps in understanding the market’s fractal nature and positioning for key inflection points based on wave maturity.

MSTRFVG broken so mstr is a moon guys i have shares from last week but most of my money is in nvidia if im right ill make 6 figures off of this bounce

$MSTR bear flag forming; Daily $350 targetHello, quick mobile chart posting here. Simple looking bear flagging forming. Bitcoin having some downside action, I imagine Saylor will be buying some Bitcoin soon again as well. This should see $350. Looking for a short. + geopolitical turmoil hits crypto/Bitcoin the hardest and most violent. The 20 and 50 EMA are aligned as well with the Supertrend Downtrend showing $350.
WSL.

Dead Cat BounceOn the daily level, we see a 5.09% risk on the upside, whereas on the downside the risk factor comes in at 4.07% for now. From a risk perspective, resistance on a closing basis stands at 40685, yet the risk on the downside begins at 37135.

MSTR Long IdeaIF Bitcoin breaks new ATH next few weeks, MSTR cup and handle impossible to ignore with a target of 1.618 fibonacci extension as target 1......
Moonboi thoughts.

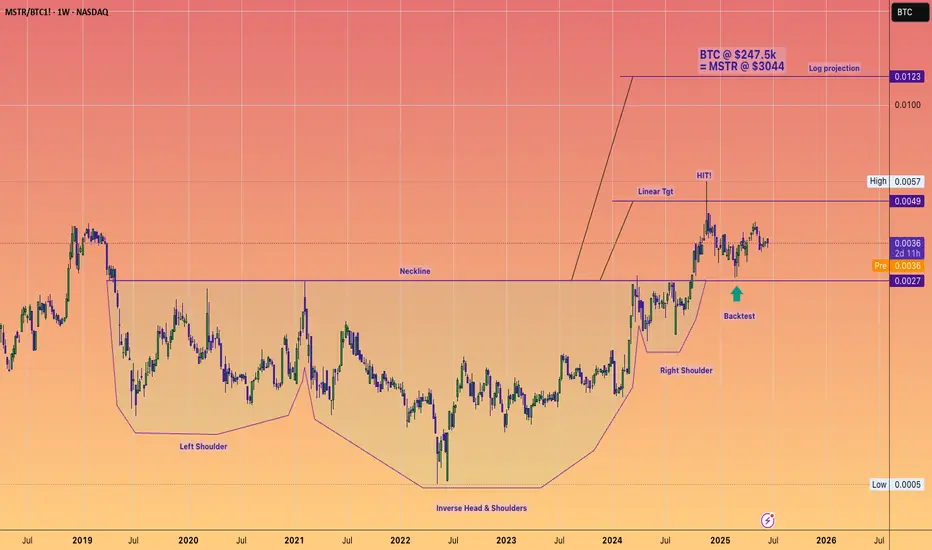
MSTR in SatoshisI'm touching base on MSRT/BTC because we had another touch of this overhead - confirming the overhead basically, and predicting that if we touch this overhead again, we get a breakout.
Nothing has changed in the gameplan. It's just taking time. Time is a rare luxury, and most people don't have it, so the market works to strip the impatient and give to the patient. The market is tuned against you, and still you think you can outwit the market, but it's impossible if you don't have time, and very few do.

$MSTR ONCE IN A LIFETIMEMSTR working on an inside month
Looking for a breakout if we can clear the monthly HIGH last add on the 618 Fibonacci was A HUGE WINNER!
Will keep yall posted here all I ask is drop a LIKE for me!

Navigating MSTR’s Price Swings: A Smart Options ApproachOverview
MicroStrategy (MSTR) has continued to capture market attention due to its aggressive Bitcoin strategy and significant stock price volatility. In 2025, MSTR surged 41% in one quarter but also reported a massive $4.22 billion net loss in Q1, raising concerns about long-term financial stability. Analysts remain divided, setting price targets ranging from $200 to $650, largely dependent on Bitcoin’s performance and broader market conditions.
Key Developments Impacting MSTR
✔ Bitcoin Exposure: MSTR maintains a large Bitcoin position, making its stock highly correlated to BTC’s price movements.
✔ AI Integration: The company is investing in AI-driven products, which could provide diversification outside of Bitcoin.
✔ Institutional View: Analysts remain split on MicroStrategy’s valuation due to its uncertain revenue model.
✔ Macro Volatility: Market-wide sentiment, interest rates, and crypto regulations will influence MSTR’s trajectory.
Options Strategy for the Week
🚀 Iron Condor Setup for June 6 Expiration
To capitalize on MSTR’s volatility while managing risk, an Iron Condor strategy is structured within a controlled range:
- Inner Range: Sell Calls at 395 and Puts at 335
- Coverage: Buy Calls at 415 and Puts at 315
✅ Objective: Profiting from sideways price movement while minimizing exposure to extreme volatility.
✅ Risk Management: If MSTR breaks above 415 or below 315, the long positions hedge against excessive losses.

mstr/ibitthis is might be a good chart to use to see when the convertible bond holders of mstr are trading the gamma...
Back to 400+ , SoonMSTR on inv h&s look to be going to 391. Over Could make the gap a magnet. Just idea ( education only)

MicroStrategy: The Dumbest Bet on WallStreetMicroStrategy: The Bitcoin Bet Masquerading as a Tech Company
Introduction: A Software Company Turned Crypto Casino
Once upon a time, MicroStrategy was a business intelligence firm. Today, it’s a Bitcoin holding company disguised as a software business.
Its market cap has ballooned to over $100 billion, not because of its software, but because of its aggressive Bitcoin purchases. Investors aren’t buying a company—they’re buying a leveraged bet on Bitcoin.
And that bet? It’s built on debt, dilution, and dangerous financial engineering.
The Math Problem: MicroStrategy’s Obscene Valuation
MicroStrategy is worth three times the value of its Bitcoin holdings. Let that sink in.
If you buy MicroStrategy stock, you’re effectively paying three times the price of Bitcoin. It’s like buying Bitcoin at $245,000 per coin when the actual market price is far lower.
This isn’t investing, it’s financial insanity.
The Debt Trap: How MicroStrategy Keeps the Illusion Alive
MicroStrategy’s entire strategy revolves around issuing debt to buy more Bitcoin. It has borrowed $7.27 billion through convertible bonds.
Here’s how the cycle works:
MicroStrategy issues debt at low interest rates.
It uses the money to buy Bitcoin.
The stock price rises because investors think it’s a genius move.
The company issues more shares to raise more money.
It buys more Bitcoin—and the cycle repeats.
This is not a sustainable business model. It’s a Ponzi-like structure that depends entirely on Bitcoin’s price continuing to rise.
The Accounting Trick: Hiding the Losses
MicroStrategy has been misleading investors with custom financial metrics. It created terms like BTC Yield and BTC $ Gain to make its Bitcoin strategy look profitable.
But in reality? It recently disclosed a $5.91 billion unrealized loss on its Bitcoin holdings. And when that news broke, its stock dropped 8.67% in a single day.
This isn’t a company, it’s a high-stakes gamble.
The Risk: What Happens When the Bubble Bursts?
MicroStrategy’s survival depends on Bitcoin’s price never crashing. If Bitcoin falls, MicroStrategy’s stock collapses.
And here’s the worst part:
If Bitcoin crashes, MicroStrategy might have to sell its holdings, triggering a death spiral.
If investors lose confidence, the company can’t issue more debt, and the illusion falls apart.
If regulators step in, MicroStrategy’s entire strategy could be dismantled.
This isn’t a safe investment. It’s a ticking time bomb.
Conclusion: The Dumbest Bet on Wall Street
MicroStrategy isn’t a tech company. It’s a leveraged Bitcoin casino.
Investors aren’t buying innovation, they’re buying hype, debt, and financial engineering. And when the illusion fades, reality will come crashing down.
So ask yourself: Are you investing in a business? Or are you just buying the dream—before it bursts?

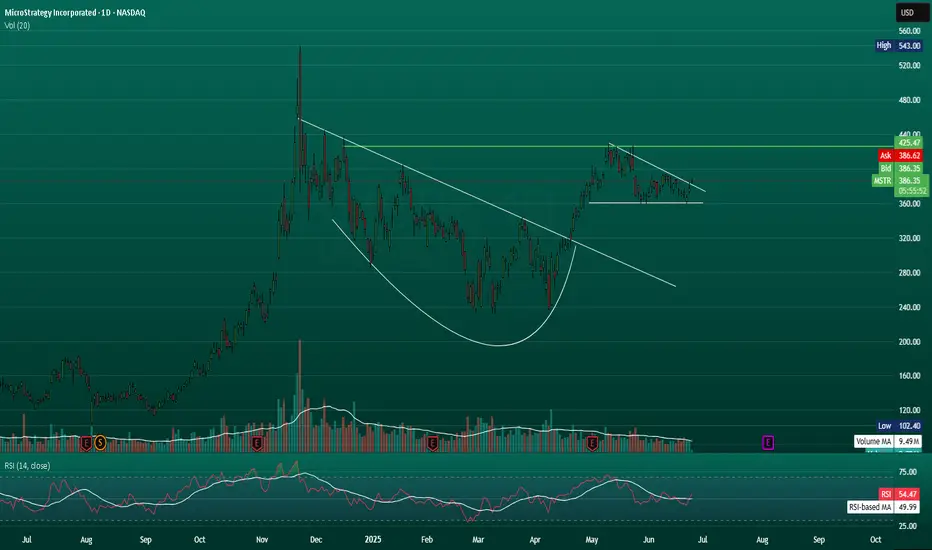
Strategy Finished Consolidating, New High With BTC Leading MicroStrategy (MSTR), the stock is currently demonstrating significant volatility and a strong correlation with Bitcoin's price movements, acting almost like a leveraged play on the cryptocurrency.
From a charting perspective, MSTR has been in a long-term bullish trend since its pivot to a Bitcoin acquisition strategy. However, it's prone to sharp corrections following Bitcoin's pullbacks, indicating high risk and reward. Key technical levels to watch would include its 200-day and 50-day moving averages as potential support and resistance zones.
The charts are now flashing strong signals that this sideways accumulation phase is drawing to a close. With Bitcoin (BTC) showing renewed strength and eyeing fresh all-time highs, MSTR, as the largest corporate holder of the digital asset, appears poised to break out. The correlation remains a potent force, and the current setup suggests MSTR is ready to re-engage its upward trajectory, targeting new price peaks in tandem with BTC

MSTR - The Saylor in the Storm!Hello TradingView Family / Fellow Traders. This is Richard, also known as theSignalyst.
📈MSTR has been overall bullish trading within the rising channel marked in blue. (log chart)
Currently, it is in a correction phase within the falling red channel.
Moreover, the red zone is a strong demand.
🏹 Thus, the highlighted blue circle is a strong area to look for buy setups as it is the intersection of demand and lower trendlines acting as non-horizontal support.
📚 As per my trading style:
As #MSTR approaches the blue circle, I will be looking for bullish reversal setups (like a double bottom pattern, trendline break , and so on...)
📚 Always follow your trading plan regarding entry, risk management, and trade management.
Good luck!
All Strategies Are Good; If Managed Properly!
~Rich

Wedge pattern - Bullish Strategy (MSTR)My expectations for June for Microstrategy stock aka Strategy. Ofc, It all depends heavily on BITSTAMP:BTCUSD

PONZI Running out of steam TOP has been in moon bois1HR bear flag LOADING!!
Look at all the JUICY gaps to fill below. Yum Yum get ya sum!!
