Long MSTROne I've been persistently bearish on for a while as part of my net bearishness on crypto, but we're at good levels now. Will take a long 210.
1MSTR trade ideas

$MSTR short the bounceWith bitcoin looking to bounce and $MSTR trading below its base value in bitcoin I believe it will have a bounce but likely find resistance in the low to mid 300s at the resistance trend line of the downtrend that is forming. Since $MSTR is leveraged up on bitcoin I would expect to see them drop a lot more then Bitcoin. If bitcoin eventually goes low enough its possible for MSTR to go bankrupt so I believe they are a good way to get exposure to shorting the crypto space.

MSTRNot financial advice.
The essence of investing & trading is the intelligent and patient preying on the greed, fear, impatience, addiction and ignorance of the majority. It's definitionally Darwinian.

MSTR lost billions in less than 1 week. Its game over for Saylor. He will need a miracle to save himself from this mess hes created. Joke of the day, "Bitcoin is a store of value and hedge against inflation". 😂

MSTR AND BITCOIN SWING BATTER AND STRIKE 3 YOUR OUTMargin CALL just started watch for the exits . tonights show on cnbc BITCOIN
Serious Risk For Microstrategy & Bitcoin (MSTR + BTC)This is a short post. Over the last few months, I've written and spoken about why Michael Saylor's entrance into Bitcoin has contributed to my skepticism about the valuation of the market, since the MSTR chart eerily echoes the bubbly behavior from the dotcom boom. As leverage and profit come out of the market, I think MSTR will be severely impacted. Saylor himself has said that holding MSTR is the closest you can get to holding a Bitcoin spot ETF. I think this is all going to backfire, and result in a precipitous drop for both. If MSTR declines back to $160 per share, I expect Bitcoin also to fall at least 50% and break the $20k line.
As shown on the left, Bitcoin can bounce at this trendline to begin the next month and perhaps make an attempt at the $50k level. This is seeming less and less likely, but you never know! I always acknowledge the alternate possibility. We'd need to see a dovish shift from the fed and/or student loan cancellation for that to occur, in my opinion.
Immediate Bearish targets for Bitcoin:
$17.2k
$13.4k
$9.7k
MSTR:
$227
$165
$121
This is not meant as financial advice. This is meant for speculation and entertainment only - this represents my opinion. There are plenty of other opinions out there :)
-Victor Cobra

$MSTR Bounce to ShortNatural covering/buyers here. Could see the lows get taken out and get shorts really worked up and emotional only to squeeze them out back to low $400s where quarterly vwap sits and is curling down. Would be a perfect way to trap new longs and also shake out the shorts looking to freeload and ride the momentum downwards. Some of this depends on BTC spot, some depends on the Q's and where the FOMC decision takes us tomorrow. IMO not a good company, pretty ugly balance sheet and I wouldn't be shocked to see this eventually go much much lower. As with intraday movements on anything tradeable, when price keeps probing lows and highs it doesn't not usually do so to bounce/reject like many retail is taught to buy/short at similar levels. It creeps around these levels to BREAK them even if momentarily, get everyone off sides and THEN make the real move up or down. Good luck.

NASDAQ:MSTR Bear of The DayMicroStrategy Incorporated provides enterprise analytics software and services worldwide. It offers MicroStrategy, an enterprise platform, which provides a modern analytics experience by delivering insights across multiple devices to users via hyperintelligence products, visualization and reporting capabilities, mobility features, and custom applications developed on the platform; analysts and data scientists with seamless access to trusted, governed data directly within their tools; and APIs and gateways, multiple deployment options, enterprise semantic graph, scalability, and security. The company also provides MicroStrategy Support that helps customers to achieve their system availability and uptime goals, and to improve the overall experience through highly responsive troubleshooting and proactive technical product support. In addition, it offers MicroStrategy Consulting that provides customers with architecture and implementation services to help them quickly realize results, and helps to achieve returns on investment derived from understanding of data; and MicroStrategy Education that offers free and paid learning options. The company provides its services through enterprise sales force and channel partners. It serves companies from a range of industries, including retail, consulting, technology, manufacturing, finance, banking, insurance, healthcare, education, and telecommunications, as well as the public sector. The company was incorporated in 1989 and is headquartered in Tysons Corner, Virginia.

$MSTR bear flag break down. Down 9% today.$MSTR bear flag break down. Down 9% today. $MSTR trades like a BTC leveraged ETF. MSTR and BTCUSD are highly correlated but MSTR is more volatile. indicators are bearish too. Dotcom bubble 2.0
Earnings coming this week.


TRADE PLAN FOR MSTRHello guys, a look at MSTR from the chart we are in a short term bearishness and we follow the chart and set our buy orders....
tradehubng

$MSTR is setup for a bear market along with BTCUSD$MSTR is what all the institutions who cannot buy bitcoin bought last year as derivative for BTC exposure. Looks like the smart money is selling MSTR. Let see what happens in the coming weeks. $MSTR is a strong indicator of how BTCUSD will perform.

MSTR - Where to Buy Next for Bulls?380-400 is my target to buy.
MacD on the daily is curling and about to cross downwards meaning there could be further downside pressure on the stock. The bottom trendline shows where to consider a high probability bull trade.
Good luck and not financial advice.

Microstrategy is copying Bitcoin??almost identical graph
is it worth buying a Stock identical to a real asset?
or is it better to own the asset? :)

$MSTR Long term 3k and higherMicroStrategy Incorporated provides enterprise analytics software and services worldwide. It offers MicroStrategy, an enterprise platform, which provides a modern analytics experience by delivering insights across multiple devices to users via hyperintelligence products, visualization and reporting capabilities, mobility features, and custom applications developed on the platform; analysts and data scientists with seamless access to trusted, governed data directly within their tools; and APIs and gateways, multiple deployment options, enterprise semantic graph, scalability, and security. The company also provides MicroStrategy Support that helps customers to achieve their system availability and uptime goals, and to improve the overall experience through highly responsive troubleshooting and proactive technical product support. In addition, it offers MicroStrategy Consulting that provides customers with architecture and implementation services to help them quickly realize results, and helps to achieve returns on investment derived from understanding of data; and MicroStrategy Education that offers free and paid learning options. The company provides its services through enterprise sales force and channel partners. It serves companies from a range of industries, including retail, consulting, technology, manufacturing, finance, banking, insurance, healthcare, education, and telecommunications, as well as the public sector. The company was incorporated in 1989 and is headquartered in Tysons Corner, Virginia.


MSTR looking to re-enter a SHORT position BTC breaking downMSTR's Michael Saylor is a FOOL. As a publically traded company he is a fiduciary and has a mandate to act responsible. Borrowing $2.5 billion dollars the company bondholders and shareholders are on the hook for to speculate on shitcoin will be the downfall of MSTR. I suspect there is (or SHOULD BE) an ongoing SEC investigation which could potentially bring indictments and a receivership of MSTR being setup to liquidate what's left of the companies assets and make the shareholders as whole as possible. Buying Bitcoin is no different that if Michael Saylor borrowed this money to buy lottery tickets, baseball cards, a 300 foot yacht. It's unlawful and not part of the overall business. MSTR will be under water soon as bitcoin continues breaking down because it is GARBAGE and has ZERO intrinsic value whatsoever like the other 18,000+ alt shitcoins. Attorneys, litigation, lawsuits, class actions will cause MSTR to be INSOLVENT.

This 22 Year-Old Resistance is Now a Great SupportMicroStrategy seems to be ready for a new leg up from here.
Price of Bitcoin can't go down by much more in my opinion (when looking at on-chain data).

MicroStrategy 4x side by sideHere's a MicroStrategy 4x side by side 1hr chart with related tickers. I'm not certain about this sideways action short term. The geopolitical situation can change Bitcoin's movements out of nowhere. MicroStrategy is either consolidating for another leg up or stalling for a short-term leg down. I'm neutral as of right now.
MSTR
BITO
COIN
BTC
Do your own due diligence, your risk is 100% your responsibility. This is for educational and entertainment purposes only. You win some or you learn some. Consider being charitable with some of your profit to help humankind. Good luck and happy trading friends...
*3x lucky 7s of trading*
7pt Trading compass:
Price action, entry/exit
Volume average/direction
Trend, patterns, momentum
Newsworthy current events
Revenue
Earnings
Balance sheet
7 Common mistakes:
+5% portfolio trades, capital risk management
Beware of analyst's motives
Emotions & Opinions
FOMO : bad timing, the market is ruthless, be shrewd
Lack of planning & discipline
Forgetting restraint
Obdurate repetitive errors, no adaptation
7 Important tools:
Trading View app!, Brokerage UI
Accurate indicators & settings
Wide screen monitor/s
Trading log (pencil & graph paper)
Big, organized desk
Reading books, playing chess
Sorted watch-list
Checkout my indicators:
Fibonacci VIP - volume
Fibonacci MA7 - price
pi RSI - trend momentum
TTC - trend channel
AlertiT - notification
tickerTracker - MFI Oscillator
3TV - 3x volume test
www.tradingview.com

Microstrategy = BitcoinMicrostrategy it is mirroring the situation of Bitcoin, with a Symmetrical Triangle that could reverse how to continue
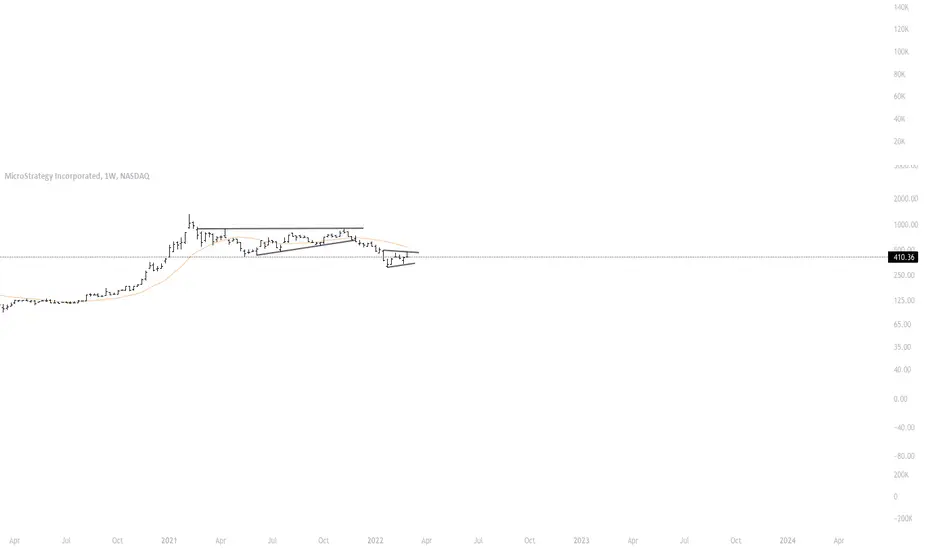
#MSTR showing us the way for #BitcoinWill it Break the current bear flag that is forming?
How it performed during the Tech wreck (like all tech stocks)
which had no earnings , but relied on future projections of user growth ( eyeballs & clicks )
Lower prices seem inevitable if his #Bitcoin holdings go into the Red

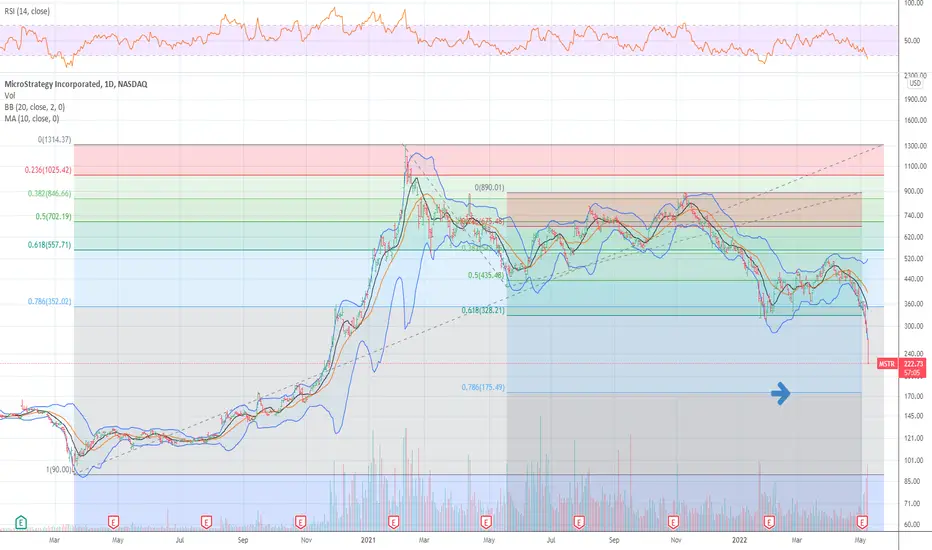
MSTR Bottom Trendline Established?Good Evening. MicroStrategy looks to potentially have found a bottom at last and a potential bottom trendline is being established. This is where bulls may want to consider accumulating for their long positions or swing trades and confirm their entry with other indicators such as low RSI, a bottom curling MacD and Bollinger Band positioning (all 3 shown).
Happy Trading!

MSTR long trade Might be into the end of an ABC correction of Elliot wave after the big boom out the low.
Into the 76 fib. Long for as long as that holds.
