Munters – Reversal Signal in the Main Channel📈 Current Status
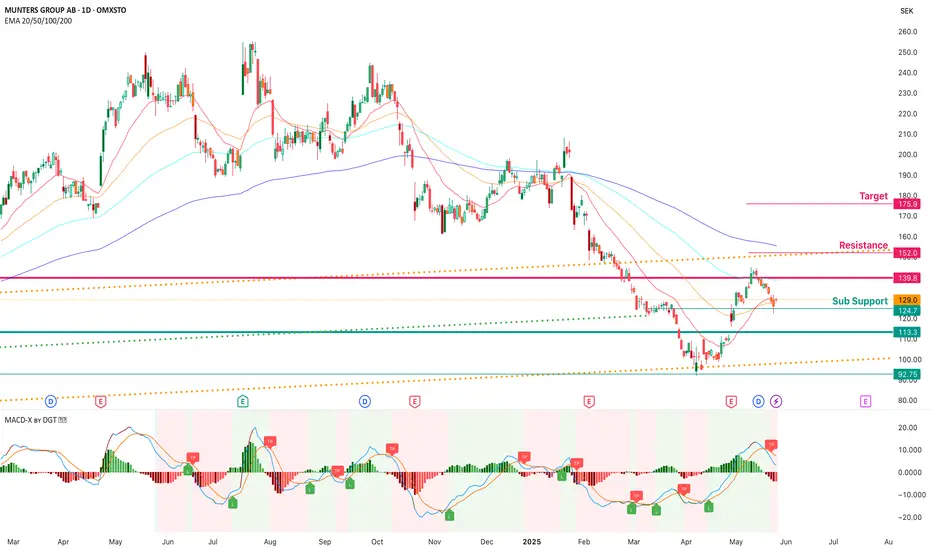
The stock is currently trading at 129.0 SEK.
After pulling back to the lower boundary of the long-term upward channel, the price is showing signs of recovery.
It has recently rejected resistance around 139–140 SEK and is seeking momentum to break through.
🔍 Technical Indicators and Structures
🟢 Upward Channel
The long-term upward channel, marked by orange lines, remains intact.
The price has bounced from the lower band, indicating a potential reversal.
🟠 EMA Levels
The EMA 20/50/100/200 lines are currently above the price, which still suggests a downtrend.
However, the price is testing these levels; a breakout could signal a trend reversal and present a favorable accumulation zone.
🟣 MACD
The MACD indicator has formed a bullish crossover, and the histogram has turned green → This points to increasing upward momentum.
🧭 Key Levels
Level Description
92.75 SEK Long-term channel support
113 – 124 SEK Strong support zone
139.8 SEK Main resistance level (recent average cost zone and area of price suppression)
152 SEK Medium-term resistance (upper boundary of the channel and expected EMA resistance zone)
175.9 SEK Target level (potential harmonic pattern completion and alignment of all EMAs)
✅ Commentary & Strategy
The price has rebounded from the support area but is struggling around 139 SEK.
It appears to be forming a base near 129 SEK for a potential upward move. On the daily chart, short-term EMAs are turning into support here for the first time.
If the price breaks above this zone, 152 SEK and then 175 SEK are potential targets.
If rejected, it could pull back to the 113–124 SEK support zone again.
1MTRS trade ideas
Long MTRS DailySimple naked priceaction.
Long from support area, my suggestion is to go for 3R in strong trend. Only 25% winrate to break even.

Swing trade for MuntersStabile company Munters with positive earnings. Going for a trade after break out over 66 if we get a buy signal. Target idea of close to channel roof.
Not necessarily a parabolic rise.
