If you fail, fail fast and learn from it. Lessons learned from my mistakes.
Rule 1: Dont lose money.
Rule 2: Never forget rule 1. Warren Buffett.
Rule 3: The market is always right.
Rule 4: The trend is your friend.
Rule 5: Dont fight the trend.
Rule 6: Figure out your method of trading and stick with it.
Rule 7: Ignore the noise. Ignore the news. Ignore the narrative. The charts are EVERYTHING!
Rule 8: Understand pattern recognition, have factors, find support and resistance.
Rule 9: Dont be fooled by lies and deception.
Rule 10: Never forget Rule #1 :)
1NFLX trade ideas

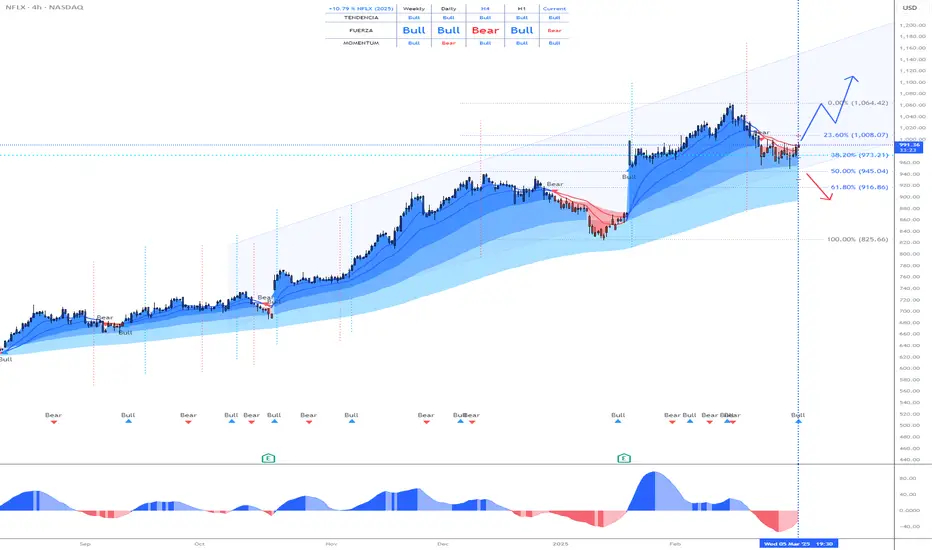
Netflix Wave Analysis – 25 March 2025Netflix Wave Analysis – 25 March 2025
- Netflix broke resistance zone
- Likely to rise to resistance level 1050.00
Netflix recently broke the resistance zone located between the resistance level 960,00 (former support from February), resistance trendline of the daily down channel from February and the 50% Fibonacci correction of the downward wave 2 from last month.
The breakout of this resistance zone accelerated the active intermediate impulse wave (3).
Given the clear daily uptrend, Netflix can be expected to rise to the next resistance level 1050.00, target price for the completion of the active impulse wave (3).

NFLX LEVELS ENDING MARCHThis is really due to pairing w TKO honestly
and I believe they will get exclusive rights to the NFL or NBA or MLB within the next 12-24 months whcih will double current revenue.
thats my outlook

NFLX eyes on $860-ish: Major Fib Cluster and Key Support to holdNFLX dropping rapidly along with the market wide pullback.
It has just hit a major fib cluster at the $859.07-865.73 zone.
If this zone fails then look lower at the $811.19-814.75 zone.
Previous Analysis that gave several entries:
========================================================
.

Netflix Gap Filled: Will the Channel Hold ?👋 What’s up, traders! Netflix is at a critical support zone—what’s your take on this setup?
🚀 Hope everyone’s having a great trading day! Here’s an interesting technical setup on NFLX. Let’s break it down together!
Netflix (NFLX) has been trading inside a well-defined ascending channel, respecting both channel resistance (upper boundary) and channel support (lower boundary). Recently, the stock experienced a sharp sell-off, leading to the completion of a major gap fill, highlighted in blue.
Historically, gap fills often act as key decision points, where price either reverses or breaks down further. Now, NFLX is testing a critical support zone at the lower boundary of the channel.
Why is this level important-:
The gap is now fully closed, removing the imbalance created by the previous breakout.
The ascending channel support is holding for now, making it a key zone for buyers.
If buyers step in, a bounce could follow, while a break below this level may lead to further downside.
Key Observations & Market Psychology-:
Gap Fill Completed: The price has fully retraced the previous breakout gap—this is often a point where traders react.
Strong Bearish Momentum: The recent decline was aggressive, showing significant selling pressure.
Volume Analysis: If buying volume increases at this level, it could indicate a potential reversal. Conversely, heavy selling volume may confirm further downside.
Confluence Factor: This support aligns with previous price action, making it a high-probability zone for a reaction. Let's discuss trading plans according to above obsevations.
Bullish Scenario (Bounce from Support)-:
If the price respects the channel support and forms a bullish reversal candlestick pattern, such as a hammer or bullish engulfing, this could trigger a bounce.
A move above $920 - $940 would indicate strength, with targets at $970 - $1,000.
A break above $1,000+ could lead to a continuation toward the channel resistance around $1,050.
Bearish Breakdown (Failure of Support)-:
If NFLX breaks below the ascending channel support with strong volume, further downside could be expected.
The next key support zone would be around $840 - $800, where buyers might step in again.
Increased selling pressure could accelerate the decline, making short positions favorable.
Educational Insight: Why Do Gap Fills Matter?
Gaps occur when price jumps between two trading sessions without any activity in between. These gaps often act as magnets, as price tends to revisit them before deciding the next trend.
Why does this happen?
Gaps represent areas of low liquidity that markets often seek to fill.
Once a gap is filled, the price either reverses strongly or continues in the direction of the trend.
Final Thoughts & Trade Approach
Netflix (NFLX) is currently at a make-or-break level, and the next few trading sessions will determine it's direction.
If buyers step in, this could be an excellent long opportunity.
If sellers push it lower, the breakdown could open doors for further downside.
What’s your take on NFLX? Will it bounce or break down? Let’s discuss in the comments!
Hope you will like the publication
Best Regards- Amit

bear call spread on NFLXWE LOOK like a head and shoulders here. The LAST time we broke below the 100 sma, we went 50% towards the 200 sma. That can / could happen again, especially with AAPL And QQQ being weak...

Elliott Wave View: Netflix (NFLX) Resumes Rally After 3 Waves CoShort term outlook in Netflix (NFLX) suggests that the ETF has ended wave IV at 853.68. Decline from 2.18.2025 high is in progress as a zigzag Elliott Wave structure. Down from 2.18.2025 high, wave ((A)) ended at 955 and wave ((B)) ended at 1000.89. Wave ((C)) lower unfolded in 5 waves impulse structure. Down from wave ((B)), wave (1) ended at 958.17 and wave (2) ended at 995.6. Wave (3) lower ended at 858.11 and wave (4) rally ended at 896.9. Final leg wave (5) ended at 853.6 which completed wave ((C)) of IV.
The stock has resumed higher in wave V, but it still needs to break above 2.18.2025 high at 1065.05 to rule out a double correction. Up from wave IV, wave (1) ended at 927.18 and wave (2) pullback ended at 887.5. The stock has resumed higher in wave (3). Up from wave (2), wave 1 ended at 917.2 and pullback in wave 2 ended at 901.27. Expect the stock to extend higher 1 more leg to end wave 3, then it should pullback in wave 4 before turning higher again. Near term, as far as pivot at 853.6 low stays intact, expect pullback to find support in 3, 7, or 11 swing for further upside.

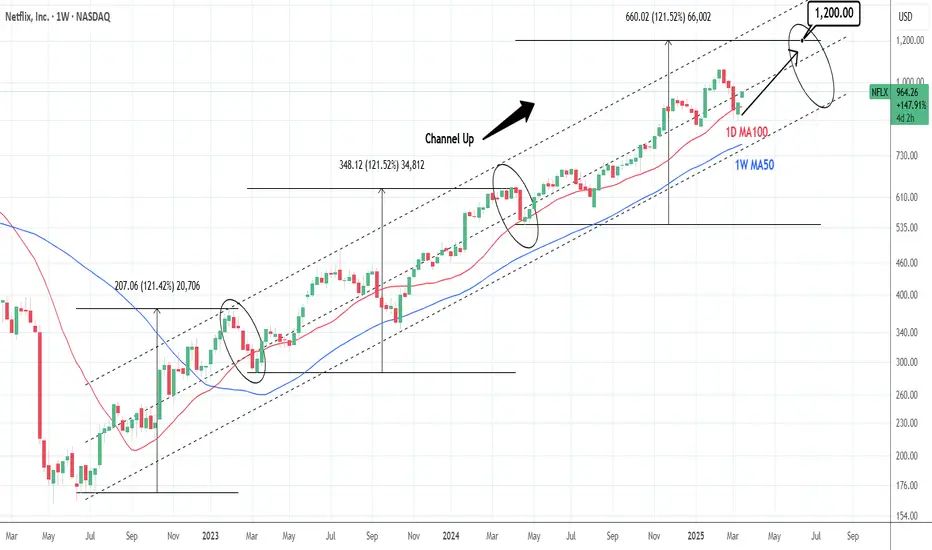
NETFLIX: Strong buy opportunity with this 1D MA100 bounce.Netflix is neutral on its 1D technical outlook (RSI = 52.399, MACD = -10.400, ADX = 30.636) and is rebounding on the 1D MA100. This is another HL on the 20 month Channel Up, which should be enough to give the stock a push to a new HH. The Channel Up is on its 3rd main bullish wave and both prior saw a +121.52% price increase. We expect the 3rd one to be completed by July. The trade is long, TP = 1,200.
## If you like our free content follow our profile to get more daily ideas. ##
## Comments and likes are greatly appreciated. ##
Netflix Caught in a Bearish Crab.The Netflix stock exhibited robust growth in 2024, primarily driven by a surge in subscribers and expansion into new markets.
However, a bearish Crab harmonic pattern has been identified on the chart, suggesting a potential significant price correction.
The pattern indicates that the stock price might initiate a decline from the 1029 level.
The XA, AB, BC, and CD legs of the pattern, defined by Fibonacci ratios, clearly outline the bearish formation. When coupled with other technical indicators, this pattern provides a compelling bearish signal for Netflix. Nevertheless, it's essential to remember that technical analysis alone is insufficient for investment decisions.
Fundamental factors, such as increasing competition, content costs, and changes in consumer preferences, should also be considered. Investors are advised to conduct thorough research and potentially consult with a financial advisor before making any investment decisions based solely on this technical analysis.
SEYED.

Max’s growth proves WBD’s content can compete with NetflixThis analysis is provided by Eden Bradfeld at BlackBull Research.
I’ve written a lot about WarnerBrothersDiscovery, and I’ve talked about it a lot in this newsletter.
Long story short — giant monolith formed by the merger of Discovery and the spun-out Warner assets of AT&T³.
The big issue was debt. They’ve managed to pay off a lot of debt — the company’s leverage ratio of 3.8x adjusted EBITDA is on its way to a ratio of 2.5x-3x gross leverage. They’ve paid a stunning 19 billion dollars of debt down in three years.
This led to their CEO, Zaz, being probably the most hated man in the industry. But that leads to strong cash flow — I’ve said before WBD is like a debt product with an equity stub; now it is slowly becoming a pure equity play, with cashflow up the wazoo — the point to remember here is that Max, the company’s streaming service, is growing well — Max added 4.5mn subscribers, versus analysts expecting 2.5mn. That’s proof in the power of their content — their IP — and it is an indication that the company’s content can compete with Netflix.
Stock is up 49% in 6 months, and trades around 11 bucks. If Zaz can continue to reduce debt, the stockholders should be very happy.

Pivoting Drop on Netflix. NFLXLast short idea was profitable for us, and I think this is a time for a pivot now. Price action is king. The drop down looked like ABC of a larger zigzag A wave, so now B which may be quite protracted. Fib goals here are for illustration purposes, as I recommend you never keep your goals stationary but use an adaptive indicator or indicator pair to exit.

Netflix: New All-time High!As expected, Netflix reached a new all-time high at $1,067, completing the magenta wave . Since then, the stock has already pulled back by nearly 20%. The ongoing magenta wave should extend further into our new magenta Target Zone, which spans $789.04 to $704.43. Since we anticipate a sustainable rebound from this range, it presents an opportunity to initiate or expand long positions. Such long entries could be hedged with a stop 1% below the Zone’s lower boundary, as there is a 30% chance that Netflix will drop below the Zone to complete the green wave alt. .

OMNICHART presents => NFLX - long term trendNetflix is still in an upward channel - in a long term bullish trend. In the coming months if it meets the support line and bounces off then that would be the time to buy leaps or scale into additional long term positions. Or start scaling in along with a put spread/s until the support line for a year. A tweak in the trade do make additional income would be to sell put at the support line for every week or month and most likely it will expire worth less and then sell a subsequent put (for week or month) at a point higher on the support line , basically keep selling your puts on the support line as time moves along and the price is above the support line. This was you might just cover the price of the long put you bought today and even make additional income. And if the stock goes up you are still making money. This buys you additional protection for free based on how disciplined you are with managing the put spread (especially the short end of it).

Netflix (NFLX) Shares Among the Biggest Losers in the US MarketNetflix (NFLX) Shares Among the Biggest Losers in the US Stock Market
According to market charts:
→ Netflix (NFLX) shares fell by approximately 8.5% during yesterday’s trading session, indicating that bulls failed to sustain the price above the psychological $1,000 per share level.
→ The S&P 500 index (US SPX 500 mini on FXOpen) hit a new low for 2025, closing down around 1.3%.
These declines reflect bearish sentiment in the US stock market, which may be driven by:
→ Uncertainty over Trump’s trade tariff policies. Yesterday, the White House postponed the introduction of tariffs on trade with Canada and Mexico for a second time, now pushing the deadline to early April.
→ Anxiety ahead of the Non-Farm Employment Change report release (scheduled for today at 16:30 GMT+3), as recession fears continue to mount.
Selling pressure was particularly strong in Netflix (NFLX) shares, as analysts (according to media reports) issued a cautious outlook on subscriber growth for the streaming giant. This may stem from concerns that the company's low-cost, ad-supported subscription model is losing its initial positive impact.
Technical Analysis of Netflix (NFLX) Stock Chart
Price movements in 2025 have formed an upward channel (marked in blue), which remains intact for now.
The $955 level, which previously acted as support, may now serve as resistance. If bearish sentiment persists, the price could continue its downward trajectory. However, bulls may find hope in key support areas, including:
→ The lower boundary of the current price channel.
→ The $870 level, which marks the lower limit of a broad bullish gap formed after a strong quarterly earnings report (as we noted on 23 January). This level has also acted as a key reversal point multiple times.
Analysts’ Forecasts for Netflix (NFLX) Stock
Overall, analysts remain optimistic. According to TipRanks:
→ The average 12-month price target for NFLX is $1,100.
→ 29 out of 37 analysts recommend buying NFLX shares.
Trade on TradingView with FXOpen. Consider opening an account and access over 700 markets with tight spreads from 0.0 pips and low commissions from $1.50 per lot.
This article represents the opinion of the Companies operating under the FXOpen brand only. It is not to be construed as an offer, solicitation, or recommendation with respect to products and services provided by the Companies operating under the FXOpen brand, nor is it to be considered financial advice.

NETFLIX: First warning of the END of the retracement!
On January 22, Netflix presented results that widely beat market estimates:
--> Sales 10,247 million dollars (+16% YoY) vs. 10,106 million dollars estimated by the consensus and 10,128 million dollars estimated by the company.
--> EBIT 2,243 million dollars (+52%) vs. 2,200 million dollars consensus and 2,190 million dollars estimated by the company.
--> BNA 1,869 million dollars (+99%) vs. 1,830 million dollars consensus and 1,847 million dollars estimated by the company.
--> EPS 4.27 dollars (+102%) vs. 4.18 dollars consensus and 4.23 dollars estimated by the company.
New subscriptions reach +18.9M, +44% YoY, vs. +9.2M expected. As anticipated by the Company, this is the last quarter in which it will publish this data. Total subscriptions exceed 301M (+15.9% YoY).
-----------------------------------------------------------------
The share price reached its historical maximum on February 18th at 1,064 and has not stopped falling since then, due to the fact that the Nasdaq index began a correction caused mainly by the volatility generated by trade tariffs.
--> What is the technical situation?
The technical aspect is CLEARLY BULLISH and any setback in the price will be a good opportunity to enter the stock.
It has reached a 50% Fibonacci retracement (945), an area that it has respected, and that therefore, can be taken as the LOWER to start a NEW BULLISH IMPULSE.
--> What risks does it have?
Trump's TARIFFS, since they can cause falls in the NASDAQ INDEX that drag down the entire market. But the Nasdaq index is in a VERY PROBABLE LOWER area, so the ENTIRE market could rise strongly in the next few days.
-------------------------------------
Strategy to follow:
ENTRY: We will open 2 long positions if the H4 candle closes above 992
POSITION 1 (TP1): We close the first position in the maximum area (1,061) (+7%)
--> Stop Loss at 940 (-5%).
POSITION 2 (TP2): We open a Trailing Stop type position.
--> Initial dynamic Stop Loss at (-5%) (coinciding with the 940 of position 1).
--> We modify the dynamic Stop Loss to (-1%) when the price reaches TP1 (1,061).
-------------------------------------------
SET UP EXPLANATIONS
*** How do we know which 2 long positions to open? Let's take an example: If we want to invest 2,000 euros in the stock, what we do is divide that amount by 2, and instead of opening 1 position of 2,000, we will open 2 positions of 1,000 each.
*** What is a Trailing Stop? A Trailing Stop allows a trade to continue gaining value when the market price moves in a favorable direction, but automatically closes the trade if the market price suddenly moves in an unfavorable direction by a certain distance. That certain distance is the dynamic Stop Loss.
-->Example: If the dynamic Stop Loss is at -1%, it means that if the price drops by -1%, the position will be closed. If the price rises, the Stop Loss also rises to maintain that -1% in the rises, therefore, the risk is increasingly lower until the position becomes profitable. In this way, very solid and stable price trends can be taken advantage of, maximizing profits.
NFLX - NetFlix is overhyped an TA says tooBesides what I think about NFLX (bad for you, poor quality & service, lairs etc.), there is something that can be used to rate and judge a Stocks pricing - The Technical Analysis.
The white Fork projects the most probable path of price. The U-MLH is the upper stretch, the L-MLH the lower and the CL is the Center, where price is in equilibrium.
Where is price now?
It mooned to the upper Warning-Line!
Such moves are insane, crazy, not healthy and produce by manipulation and/or greed that eats Brains.
However - As I follow the rules of the Medianlines (Forks), I know that price is hyper extended up there. So, it can't go further? Of course it could. But Chances are poor that it will.
Instead, Chances are high that price falls down to the U-MLH. At least.
Why?
Besides price is stretched, it failed to move up to the next Warning Line (WL2).
So, there you have it.
I'm shorting NFLX and my target is at least the U-MLH, with further downside potential with PTG2 at the Centerline.

NFLX long swing (conditional)Intraday profits taken. Tradingview doesn't let less than 15m timeframe chart to be published. The path was drawn on 5m chart when 15m candle created displacement above the H1 SIBI. This long trend idea depends on how indices do. For NFLX the technicals are there and any support from indices would see NFLX move higher, and possibly the weekly reversal with the President possibly announcing something later today that may impact the market. A bit of uncertainty around, but let's see.

Netflix (NFLX) Scalping Strategy🔥 Market Overview:
Trend: Short-term recovery, but price remains under key resistance.
Key Levels:
Resistance: $995.00, $1,010.00
Support: $987.00, $975.00
Indicators:
EMA9 near EMA200 → Price consolidating near equilibrium.
MACD negative → No strong bullish momentum.
RSI at 52.41 → Neutral, no clear divergence.
Risk of Short Squeeze? Low—only if price breaks $995.00.
Market Maker Activity: Some accumulation, but still within a range.
🔥 Scalping Strategy:
🩸 1. Momentum Scalping (If Breakout Above $995.00)
Buy near: $995.10
Target: $1,010.00
Stop-loss: $990.00
Risk-to-Reward: 1:2
🩸 2. Range Scalping (If Price Holds $987 - $995)
Buy near: $987.00
Sell near: $995.00
Stop-loss: $985.00
Profit Potential: ~2.4%
🩸 3. Breakout Scalping (If Below $987.00)
Short below: $987.00
Target: $975.00
Stop-loss: $990.50
Risk-to-Reward: 1:3
🔥 Mid-Term Trend Forecast (1-3 Weeks):
If $995.00 holds, Netflix could push towards $1,010.00 - $1,020.00.
If $987.00 fails, expect a drop to $975.00.
🔥 News & Market Context:
Netflix facing pressure to increase production in Los Angeles → Potential regulatory risks.
Stock up 1.31% today → Short-term bullish momentum but not decisive.
Earnings in 55 days → No immediate catalyst for a big move.
👑 Trade Rating (1-10):
Range Scalping: 7/10 (Good but needs confirmation).
Momentum Long Above $995.00: 8/10 (Breakout setup).
Short Below $987.00: 9/10 (Best risk-reward setup).
🔥 Decision:
🩸 Short-term Play: Range scalping $987 - $995 until a breakout.
🩸 Mid-term Play: Break above $995.00 = long; below $987.00 = short.
🩸 Ideal Play: Watch for price reaction at $995.00 before committing.
👑 Final Verdict: Wait for confirmation—price is still in a range.
🔥 LucanInvestor's Quote:
"Trade the setup, not the hype."

Netflix (NFLX) Scalping & Mid-Term Analysis🔥 Market Overview
Trend: Bearish 📉 (Strong downtrend)
Resistance: $972.00 → EMA 9, acting as a short-term ceiling
Support: $955.00 → Local demand zone
Indicators:
MACD: Bearish, no reversal confirmation
RSI: 41.53 (Neutral, no oversold signal yet)
VWAP: Below average, sellers still in control
🩸 Risk: NFLX is in a short-term freefall—possible more downside
🔥 Scalping Strategy (5x Leverage)
🩸 Momentum Scalping:
Buy: Near $955.00–$958.00, targeting $965.00 (+1.0%)
Sell: Near $970.00–$972.00, targeting $958.00 (-1.2%)
Stop-loss: Below $952.00
🩸 Breakout Scalping:
Above $975.00: Long to $985.00 (+1.6%)
Below $955.00: Short to $945.00 (-1.5%)
🔥 Mid-Term Trend Forecast (1-3 Weeks)
Bullish above $980: If momentum shifts, expect $990-$1000
Bearish below $950: Freefall potential to $930-$920
🔥 News & Market Context
🩸 No immediate catalysts, earnings in 56 days
🩸 Sellers dominating, no major support nearby
🔥 Decision:
🩸 Short-term: Scalp long near $955.00, sell at $965.00+
🩸 Mid-term: NFLX is weak—best play is waiting for lower entries
🩸 Ideal Play: Short bounces, confirm strength before aggressive longs
👑 Final Verdict:
"Falling knives don’t make safe catches—wait for the grip." – LucanInvestor

NFLX, Short, 1D✅ NFLX formed a clear rising wedge pattern and rejected the resistance, signaling a slight bearish move. The price is expected to move lower toward the support of the rising wedge.
SHORT 📉
✅ Like and subscribe to never miss a new analysis! ✅

Netflix Flips. NFLXA correction is well overdue on this one. There is a convincing constellation of indications on this price action, so where to begin?
A five wave impulse appears to be complete, and price action reverses tonality of the previous impulsive bullish candles. Divergences on RSX, BB%PCT. MIDAS line is crosses, while vWAP and US lines are aligned and are above the candle. VZO crossed bearishly and trigger line crossed the ribbon. BB%PCT is now bearish crossing the zero line and Ehler's Stochastic RSI is bearish as well and has been for a while.

NFLX 2-21🔥 Market Overview:
Trend: Bearish; price rejected at resistance and struggling to reclaim key levels.
Key Levels:
Resistance: $1,030, $1,045.
Support: $1,020, $1,010.
Indicators:
MACD: Bearish crossover, indicating downside pressure.
RSI: 55.05, neutral but losing momentum.
Supertrend: Bearish, confirming short-term weakness.
🔥 Scalping Strategy:
🩸 1. Momentum Scalping
Buy near: $1,020, targeting $1,030 (+1.0%).
Sell near: $1,030, targeting $1,022 (-0.8%).
Stop-loss: Below $1,015.
🩸 2. EMA Pullback Scalping
Buy near: $1,020 (EMA 9), targeting $1,028 (+0.8%).
Sell near: $1,030, targeting $1,020 (-1.0%).
Stop-loss: Below $1,015.
🩸 3. Breakout Scalping
If $1,030 breaks, enter long toward $1,045 (+1.5%).
If $1,020 fails, short toward $1,010 (-1.0%).
🔥 Mid-Term Trend Forecast (1-3 Weeks):
Holding above $1,020 could trigger a recovery toward $1,045.
A breakdown below $1,010 confirms a deeper correction.
Short-term weakness dominates unless bulls regain control.
🔥 News & Market Context:
Netflix remains volatile, trading within a defined range.
No major catalysts, leaving technicals to dictate movement.
Broader market conditions favor defensive trading.
🔥 Decision:
🩸 Short-term: Scalping between $1,020–$1,030 is the best play.
🩸 Mid-term: Bearish unless $1,030 is reclaimed.
🩸 Ideal Play: Trade with caution—no strong momentum shift yet.
👑 Final Verdict:
Markets punish hesitation—either execute or stay out.
🔥 LucanInvestor:
"Only those who adapt to market shifts survive."

Netflix Scalping + Forecast (2-19)🔥 Market Overview:
Trend: Strong bullish momentum, but facing short-term resistance.
Key Levels:
Resistance: $1,062.50 (Supertrend level), $1,080.
Support: $1,029.00, $1,007.00 (EMA 200).
Indicators:
MACD: Weakening bullish momentum—potential for a short-term pullback.
RSI: 56.11, showing slight overbought conditions but still in neutral territory.
Supertrend: Bullish, but the trend is flattening.
🔥 Scalping Strategy:
🩸 1. Momentum Scalping
Buy near: $1,040.00, targeting $1,060.00.
Sell near: $1,062.50, targeting $1,030.00.
Stop-loss: Below $1,028.00.
🩸 2. EMA Pullback Scalping
Buy near: $1,029.00 (Supertrend support), targeting $1,050.00.
Sell near: $1,062.50, targeting $1,035.00.
Stop-loss: Below $1,020.00.
🩸 3. Breakout Scalping
If $1,062.50 breaks, enter long toward $1,080.
If $1,029.00 fails, short toward $1,000.
🔥 Mid-Term Trend Forecast (1-3 Weeks):
If price holds above $1,029.00, expect continuation toward $1,080+.
If it fails, a retracement to $1,000 is likely.
The trend remains bullish, but consolidation is expected.
🔥 News & Market Context:
NFLX continues its uptrend, but momentum is slowing.
No major catalysts—price action is technical.
🔥 Decision:
🩸 Short-term: Scalping within the $1,029–$1,062 range is ideal.
🩸 Mid-term: Wait for a breakout confirmation.
🩸 Ideal Play: Trade within the range while watching for breakout potential.
👑 Final Verdict:
A strong trend does not mean a free ride—resistance is the test of conviction. Trade with precision or watch from the sidelines.
🔥 LucanInvestor’s Statement:
"Markets reward those who act with certainty. Hesitation is the graveyard of opportunity."
