Nokia - The old indestructible phone, on support zone?Good week everyone!
NOK opened on friday with a 4% big gap down just over the 200 daily sma and weekly 50ema, and so far rejected it.
Overall the stock is on a uptrend channel as we can see on right chart.
Now what really draw me attention is the huge volume on friday, way over average, is that just panic? someone was buying there right?
Now i'd not buy outright, i wanna keep an eye on the price behaviour next few days to be sure that will be no more frenzy seeling panic, if price manages to stay above daily 200sma therefore we can have a good buy opportunity targeting just below weekly 200sma.
As far we can see the selling waves has not to much volume right now, there is lack of interest on short this stock right now which is a good confluence for long here.
And RSI is almost oversold, just another small confluence for saying.
This Trading Idea is to be used for educational purposes only. This idea does not represent financial advice and its NOT a signal. You should trade based only on your own technic and knowledge.
1NOKIA trade ideas

Nokia potentially oversold on the alcatel lucent newsFundamentals:
Nokia took a big hit after stating that they are starting an internal investigation on alcatel lucent which they have bought. Investors reacted pretty hard to this and the stock was diving more that -8% during that day. It of course could be that there will be some negative facts to be found and in the worst case even some fines to be had. So there is of course a risk associated with longing the stock at this point.
However, let's consider this from a different perspective. The company decided willingly to start investigation and they contacted officials by themselves and they do not expect any concrete consequences on the company itself based on the investigation results. Of course this is their own statement and view on the matter and they would ideally always want to make it look like a minor thing even if it weren't. However, considering the other possibility that there won't be anything significant to be found on the investigations and there won't be any fines. The stock has dived more that -5% based on these news and the fear of the potential results. If nothing will be found this would suggest the stock was significantly oversold and should be looking to recover.
Techical side:
The technical side is quite simplistic. RSI9 shows that the stock is on the edge of being oversold and looking at the previous behavior the level 30 has often provided support and the price has bounced up. Sometimes of course this has been violated and can be the case here as well. However just considering the option that after the stock has been up and being valuated at the previous levels 5.25 - 5.6 after Q4 report it would be quite hard to believe the proper value would be below 5€ which is of course a very important support level.
Considering the both sides on this price crash I would suggest that Nokia is currently oversold and will be recovering when the investigations continue and if they show no concrete results suggesting significant fines to be had. I'd be looking to long Nokia now or at the fibonacci support at 5.065 which has been already tested briefly once. Stop loss should be placed below 5.065 support or 5.00 depending on your risk tolerance and personal view on how confident you are on these news.
Lastly considering the option that the investigations bring up skeletons in the closet and significant fines are had then the stop loss is still quite small and the potential reward in my opinion clearly out weights the risk.

Nokia Buy SignalThere's been a lot of positive news surrounding Nokia as of late, and the Megalodon just gave us the buy sign!
The Megalodon indicator uses an artificial intelligence, combined with data from over 500 buy setups, and over 2000 indicators to produce extremely accurate buy signals on any and all asset classes!


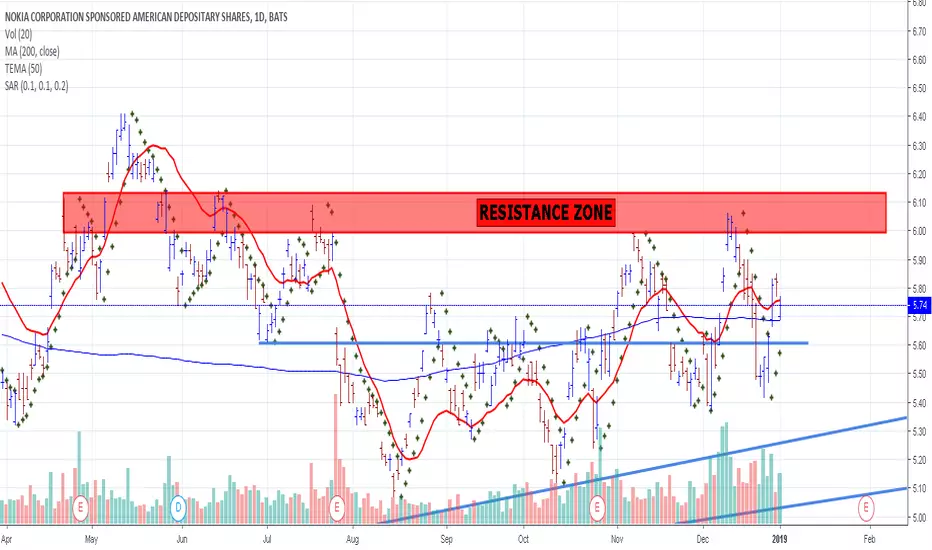
NYSE:NOK NOKIA daily chart could be a good run NYSE:NOK price is above MA200 and I pay attention if is approaching resistance zone .
Resistance zone it is a TA point of view and I can say it is psychological level as well and it is proved that can influence price direction depends of circumstances .
NOK.nyse NOKIA as a long term investment Nokia is coming with new phones and improved ones in 2019 plus new deals around the glob as we can find info around the net on financial news channels.
From a price point of view I think is a good buy for long time holding as investment plus has a good dividend .
The price is under SMA 200 on weekly chart.
Please feel free to comment with new ideas or critics .
Thank you .

what doesnt kill you make youy stronger...?Is #nokia going to show back to the worLD how a phone is supposed to be?

Nokia could drop lower after temporary relief from triangleThe breakdown below wave D of 5.07 is needed for confirmation.
It could be a 78.6%-100% retracement and even beyond of a previous move to the upside in Y2012-2014.

Extremely Bullish Set-up For NOKIAExtremely Bullish Set-up For NOK - Needs to Breakout & Retest To Be In Play: 2019 YE Target 8.5€ / 2020 Target 23€ (!!)

Nokia 5G prowessNokia is 4.2% div. yield 5G stock. Awaiting if going back to 786fibretracement below or near 5 or stabilizing upward to 618fibretracement.
NOKIA (NOK) Still bordering marginally negative earnings, indicating it's emergence from post 2000's is emerging with new IT Software for 5G as earnings about to turn profitable.
Watch for further support for growth or retracement to .786 from .618 bounce it's currently on.

NOKIA POTENTIAL 3 WAVE CORRECTION FOR ONE MORE WAVE DOWNNOKIA seems consolidating to make one more wave up. If it completes this X wave i'm expecting one more wave down.

Nokia observations on Weekly (simple)Seems like in our current state Nokia is preparing for another touch of the upper line of the triangle.
This seems to be further supported by Hull Macd. If volume is weak we will move sideways and eventually test the lower border of the triangle.
Depending on the Q4 of the company we will either break up or down from the triangle. This will trigger hold or sell among investors.

NOKIA READY TO MOVEALL MY INDICATORS SAY THAT NOKIA IS ABOUT TO MOVE. IT TOOKS SOME ITS BUT I THINK IS ABOUT READY TO HEAD BACK TO THAT $6 MARK. PERFECT TIME TO BUY S SET OF OPTIONS WITH A LONG EXPIRATION.

NOKIA GRAPH ANALYSIS (trying new techn) - Multi path predictions*Note - this is my first graph of not using chart patterns but just trying to fit stuff together to predict. Please take the prediction with a grain of salt.
The marked intersection point seems like the most likely point for a breakout with multiple conversions. Looking at the different paths, it should be possible to predict the future direction!
Again, feedback would be awesome this is legit just a random graph I made.

NOKIA Long IdeaBuy NOKIA after the bounce on the confluence between the broken bearish trend line, the ascending line and the support zone. Also the price is trapped into an interesting fibonacci level. A good price action could be the trigger to buy the stock.


If I'd ever seen a cup and a handleAs the fundamental cyclical business is improving with 5G, the technical picture looks interesting. We have now corrected 50 % of the move from earnings. Looking for signs for a classic (Elliott) wave 3 bullish trade. Also resembles a cup and a handle. With the fundamental backdrop in mind, hard to see this melting down from here. Need to capture the declining RSI trendline swiftly though.

Nokia going downThe first time I noticed Nokia was when they suddenly beat their profits.
At the time I noticed what a disaster has the company been since 2007. It got some respite, as Microsoft bought it, but it did not do a lot of good.
Even during 2017, when the world experienced a record boom, Nokia was like - Hold my beer! - and the stock went down.
Recently the price recovered as they turned out to have sold some of their licenses or other stuff, but .. I don't get it.. How is selling off assets considered good.. Must have been algos and "smart" people buying, who just look at EPS.
From a technical perspective.. Looks like the resulting surge has finally hit a resistance on the daily chart. The charts shows that it will go down.
Both aspects align.. so I expect it to go down.
By the way, who has a Nokia or Microsoft phone? ;)


Nok Nok Hi guys. I'm humbly presenting another high volume idea today. All my stock ideas are long term. Everything else are quick deals. Thank you for taking a look.

