Nokia 13.08.2014 may be interesting in 15m diagramAs you can see in diagram Nokia (NOK) has made some consolidations for tree days now that is like a reversal pattern (bottoming).
It is trying to breach the KUMO and the KUMO twists.
MACD and RSI is trying to get bullishness trend.
I think this is a very interesting point of a long setup for 7.85 first and 7.99 secondly.
1NOKIA trade ideas

long NOK on break until earningsprice broke above range on high vol
oscillators turning aroud and bands are expending (in weekly chart)
could be volatility squeese
trade NOK to earnings with target at 9.10$
long term targets 10.5$ and finaly 11.6$
GL

NOK 4x move from origianl entryOur original analysis stated in part:
"Taken by itself, the technical pattern on the chart is a classic bottom with a follow through support at the first real pullback. Many unexpected huge moves have resulted from this pattern over the years. A factor in NOK's favor on the long side is the price action at the LT Swing Long entry range. It has been very aggressively bought immediately upon reaching the entry range and the Intraday Long has been bought at both tests of the entry range.
Keep in mind that although this published chart is on a 60 min time-frame, the levels shown are Weekly Chart levels and must be traded as such. Being such a low-priced stock is a factor in NOk favor for scalpers and Day traders, and we can be certain that there will be buyers at most long setups from this time forward until the LT Swing Long is definitively broken or reaches its' targets, which are not shown at this time."
Buyers have indeed entered at every pullback, the LT Swing Long has held, and there has been a huge move of 4x the original entry price.
With such a low-priced stock, it is not uncommon to see a larger move before any meaningful pullback occurs. There is a short being sold but not shown on chart.

NOK-updateStill running for the 11-13 level and it looks that price reached a reversal zone- or a slight pullback in the making. Good opportunity for adding or buying.


NOK- FB look alikeInteresting pattern in both NOK and FB yet differnt as harmonic pattern. NOK shows a sea horse pattern and a long entry would be after the price gets into 7.40-7.50 area.

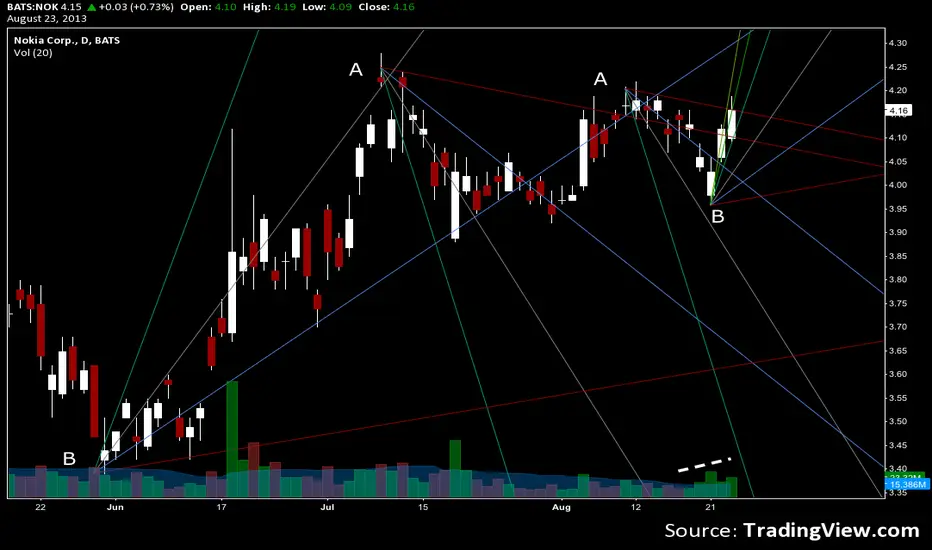
Nokia is moving up. Using Gann Fans to illustrate the increase in bullish movement in this equity. The chart is composed of four fans. The fans labeled A are identical twins. The fans labeled B are also twins. Looking at these fans it is clear NOK is moving up at a much faster rate as it looks to clear the red angle of fan A. Volume also increasing.

Nokia multi-years Elliott Wave countIf my count is correct, the price should go up for some time (end of the year?) and then proceed to do the last wave down.

Nokia CloneUsing nmike's techniques, I picked three points for my circle and enclosed it in a rectangle. Then , cloned this rectangle to form a larger rectangle consisting of 10 smaller ones. Next I drew trend lines (yellow x) connecting the corners of the larger rectangle. {Note: this is where I deviated from nmike's instruction) The trend lines forming the yellow x and a horizontal trend line drawn at the center of the large rectangle are references for all cloned lines forming the grid. Placement of trend lines began at corners of smaller rectangles and later intersections of trend lines. I have been experimenting with different versions of nmike's cloning method and this appears to be one of the better ones. Currently price is traveling in a channel it has been in since May but now is nearing a junction.


Nokia's turnSince July, the market appears to be turning in Nokia's favor for the first time in a long time, as price broke out of consolidation. Price continued it's new trend of breaking old lines today. Next bullish target is near 4.60.

NOKIA MONTHLYNOKIA should have made a multi decade low and risk/reward is on the long side of the trade.
Monthly gap close is ca $9 being target of the early stage of a multi year rally

Nokia, possible run until ER results?Possible short term spikes to the upside before the ER on July 18. However, if ER fails to impress may repeat what happened previously.

NOKIA Bearish Times AheadRead chart. Be carefull in Nokia as in other things. Cash is very good to have, in fact Cash IS KING !!

NOKWeekly chart. Attempted to breakout of Stage 1 & got the PB. Looks set to begin Stage 2 w/ rising RSI.


The Age Old Greed and Fear...Greed is a powerful emotion, but fear the strongest and this chart shows that indeed trust comes slower than distrust.
The first and second period have about the same win/loss rate of 1,63%. The resulted in the first period for a gain of a whopping 3,121% in only 215 bars. However, the second period whipped 83% of that gain away and did that in just 107 bars, just shy of half of the 215 bars in the first period.
The third period of recovering resulted in a gain of 349% in 271 bars, however the fourth period destroyed 95% of that gain in 240 bars. That's 31 bars less than the third period, however the rate of loss was 1.24% opposed to the rate of winning of only 0.56%


NOK NokiaNokia has negative divergence, wait for positive divergence movement. Fundamentals : www.reuters.com Their balancing sheet is not looking too good thought. Closed Loss on 3.73 www.marketwatch.com


Nokia Horizontal?I'm watching for a repeat of what occurred SEP-OCT 2012 as $NOK consolidated. Wait for it to get closer to the next earnings report.
