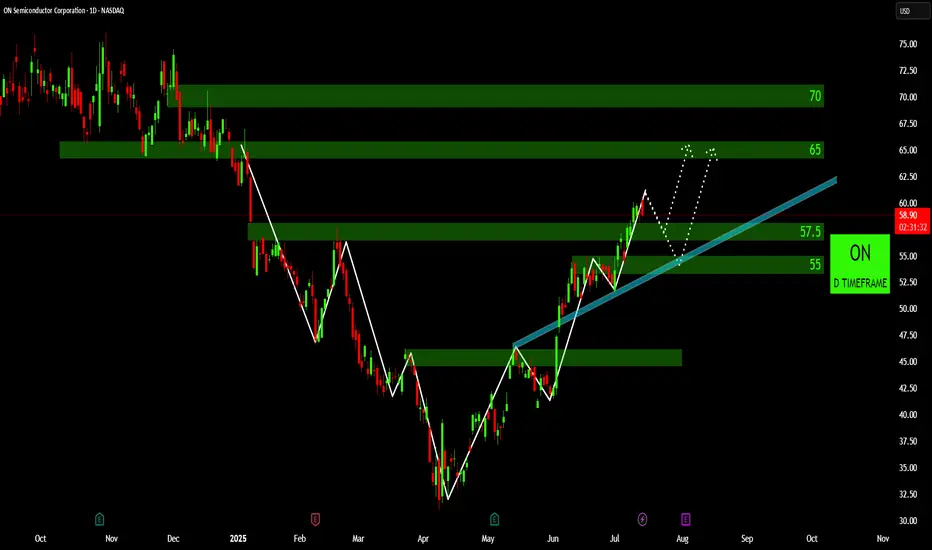
A Technical Review of ON: Trendlines and Potential TargetsBullish Trendline in Play : The price action since late April/early May clearly demonstrates an upward-sloping trendline (highlighted in light blue), indicating a sustained bullish momentum. The price has respected this trendline on multiple occasions, suggesting its significance as dynamic support.
Recent Breakout and Retest of Resistance : The chart shows a recent decisive breakout above the 57.50 level, which previously acted as resistance. Following the breakout, the price has seen a retest of this level, successfully holding above it, which is often a bullish confirmation.
Identified Supply Zones Ahead : There are two distinct green-highlighted zones above the current price, marked at 65 and 70. These represent potential supply zones or resistance levels where profit-taking or increased selling pressure could occur.
Potential for ABCD Harmonic Pattern : The dotted white lines indicate a potential ABCD harmonic pattern formation. Should this pattern play out, it suggests a possible corrective move towards the 55-57.50 zone before a further upward trajectory towards the 65 and then potentially 70 levels.
Key Support Zone Established : The green-highlighted area around the 55 level, coinciding with the bullish trendline, appears to be a significant support zone. A sustained breakdown below this level would invalidate the current bullish structure and warrant a re-evaluation of the trend.
Disclaimer:
The information provided in this chart is for educational and informational purposes only and should not be considered as investment advice. Trading and investing involve substantial risk and are not suitable for every investor. You should carefully consider your financial situation and consult with a financial advisor before making any investment decisions. The creator of this chart does not guarantee any specific outcome or profit and is not responsible for any losses incurred as a result of using this information. Past performance is not indicative of future results. Use this information at your own risk. This chart has been created for my own improvement in Trading and Investment Analysis. Please do your own analysis before any investments.
1ON trade ideas
ON Semi is bullish and ready to march forwardNASDAQ:ON price action is bullish, anticipated price action and targets are shown on the chart, stop loss daily close below 20MA.
PS. My view only, not financial advice!

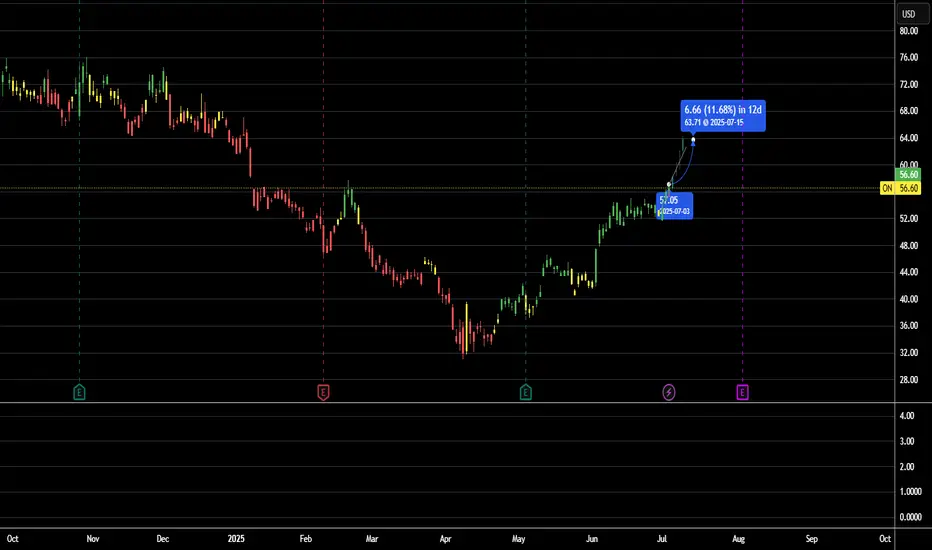
Trade Plan (Short-Term Swing) for $ON🔍 Chart Setup & Trend
Timeframe: Daily chart
Trend: After a prolonged downtrend, NASDAQ:ON appears to be forming a base and attempting a short-term reversal.
It is testing resistance around $57, and a breakout could trigger bullish continuation.
Price is approaching the 50-day EMA, which is a key level to watch for confirmation.
📊 Key Indicators
RSI: ~52
↳ Neutral, but trending upward. Room to grow before hitting overbought levels.
MACD: Bullish crossover just occurred
↳ Momentum is shifting in favor of the bulls.
Volume: Modest uptick on green days—sign of early accumulation.
🔧 Support & Resistance
Immediate support: $54.80 (recent swing low)
Resistance 1: $57.00 (current test level)
Resistance 2: $60.00
12% Target Price: $63.40
🎯 Trade Plan (Short-Term Swing)
Entry Zone: $56.60–$57.10 (on confirmed breakout)
Price Target (12% gain): $63.40
Stop-loss: $53.90 (below recent low and EMA20)
Risk/Reward Ratio: ~1:2 or better depending on entry
ON is on!!We are opening at 44 which is the contracts the flow picked up (once again they were right)
But this chart is showing a lot of potential, as we broke above the trendline, i will watch 45 for an entry with a possible $60 target
ON Semiconductor – Reaction at 78.6% Fib, Decision Time at $49.7NASDAQ:ON just reacted to a key 78.6% Fibonacci retracement from the April 2020 low to its all-time high.
After a make-or-break earnings on May 5, price has pushed into a major resistance zone at $49.75. Interestingly, analysts are averaging a price target of $47, slightly below current levels.
💡 Key Setup:
78.6% Fib retracement bounce (long-term move)
Resistance: $49.75
Average analyst target: $47
📅 Summer move will likely be decided in the next couple of weeks. Breakout or rejection? The chart is at a critical inflection point.
Drop your bias in the comments: 📈 or 📉?

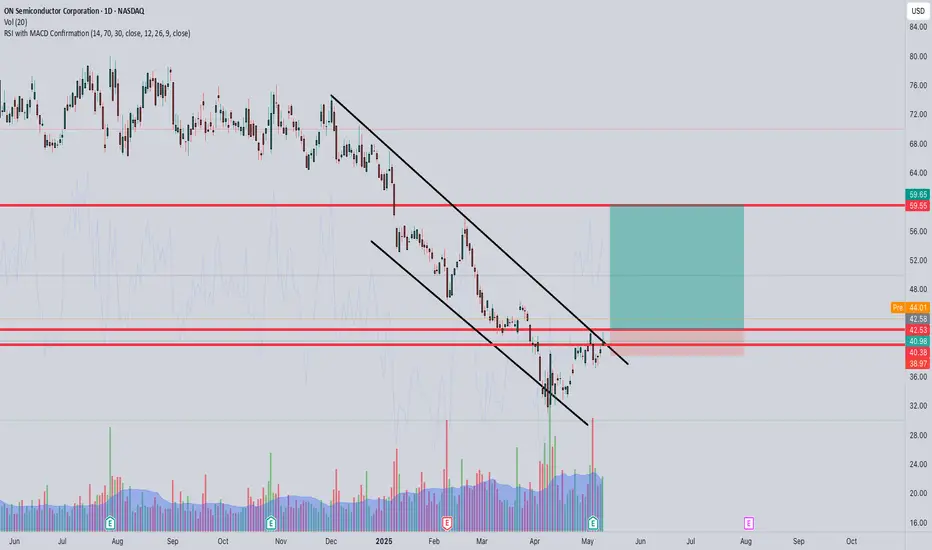
Short Trade Setup – ON Semiconductor (ON)!🔻
Timeframe: 30-Minute Chart
Pattern: Rising Wedge Breakdown (Bearish Reversal)
📝 Trade Plan (Short Position)
📌 Entry: ~$45.22 (Breakdown confirmation below wedge)
🛑 Stop-Loss (SL): $47.26 (Above wedge resistance / structure invalidation)
🎯 Take Profit Targets:
TP1: $43.06 (First support level – red line)
TP2: $40.45 (Stronger base support – green line)
📊 Risk-Reward Calculation
Risk: $47.26 - $45.22 = $2.04
Reward to TP1: $45.22 - $43.06 = $2.16
Reward to TP2: $45.22 - $40.45 = $4.77
➡️ Risk-Reward Ratios:
TP1: ~1:1.05
TP2: ~1:2.3
🔍 Key Technical Zones
🔻 Entry: Breakdown below wedge at $45.22
🧨 Stop-Loss: Above resistance at $47.26
🟥 Target 1: $43.06
🟩 Target 2: $40.45
✅ Summary
Setup favors bearish continuation below $45.22.
Clean invalidation above $47.26.
Solid R:R, especially if price reaches TP2.

ON semi watch $40.11/28: Major Fibs in tight confluence may Dip ON is recovering well along with the sector in general.
About to test a tight confluence of Genesis and Covid fibs.
Expect a Dip upon first tap, or else look for a Break-n-Retest.
$40.11-40.28 is the exact zone of interest.

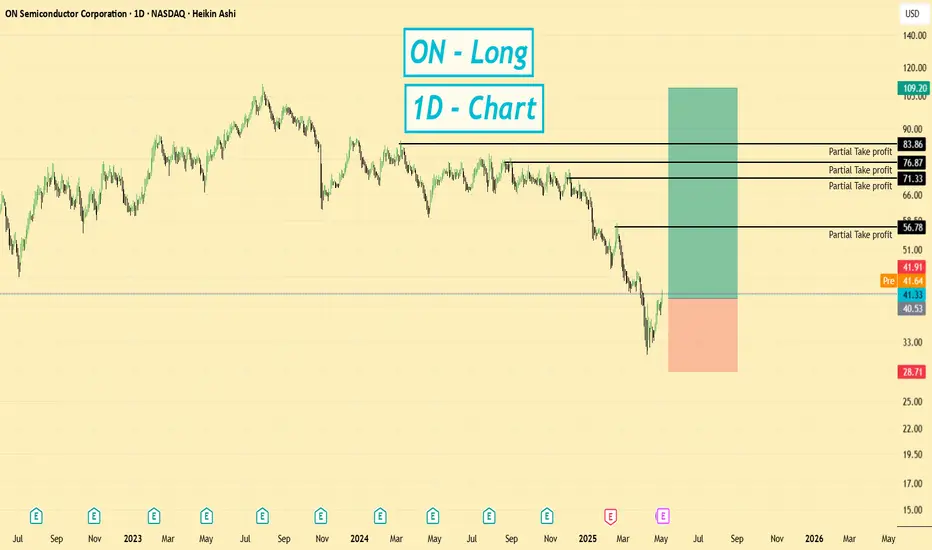
ON | Long Setup | Bullish Recovery Flow | (May 2025)ON | Long Setup | Breakout from Downtrend Channel + Bullish Recovery Flow | (May 2025)
1️⃣ Short Insight Summary:
ON Semiconductor (ON) is breaking out of its long-term downtrend channel, showing strong price action and renewed momentum. A recovery seems to be gaining speed, and May could be a key turning point.
2️⃣ Trade Parameters:
Bias: Long
Entry: Around current levels (post-breakout zone)
Stop Loss: $28 (providing extra room for potential liquidation wicks)
TP1: $56
TP2: $71
TP3: $76
TP4: $83
3️⃣ Key Notes:
The stock just broke out of its declining channel and is now testing the 50-day moving average — a common resistance, but price strength and flow suggest we might push through. We’re also sitting on a major support zone that mirrors the May 2021 level, which historically provided a strong bounce.
Here are the fundamentals:
Revenue: SEED_TVCODER77_ETHBTCDATA:7B
Net Income: $1.5B
Tangible Book Value: ~$16.50
EPS: $3.67
Free Cash Flow: $1.2B
Cash on Hand: $2.6B
Debt: $3.6B
Beta: 1.7 (fairly volatile)
The dividend yield is currently unknown, but earnings are projected to grow steadily, with strong acceleration expected heading into 2028. This setup offers a mix of technical breakout and long-term growth expectations.
4️⃣ Optional Follow-up Note:
This idea will be monitored closely throughout May. If the bullish structure holds, we could see multiple levels get hit. I’ll provide updates if price action confirms further strength.
Please LIKE 👍, FOLLOW ✅, SHARE 🙌 and COMMENT ✍ if you enjoy this idea! Also share your ideas and charts in the comments section below! This is best way to keep it relevant, support us, keep the content here free and allow the idea to reach as many people as possible.
Disclaimer: This is not a financial advise. Always conduct your own research. This content may include enhancements made using AI.
ON – ON Semiconductor Corporation – 30-Min Short Trade Setup !📉 🔻
🔹 Asset: ON (NASDAQ)
🔹 Timeframe: 30-Min Chart
🔹 Setup Type: Breakdown from Symmetrical Triangle + Trendline Breach
📊 Trade Plan (Short Position)
✅ Entry Zone: Below $45.20 (breakdown from triangle and support zone)
✅ Stop-Loss (SL): Above $45.98 (failed breakout / pattern invalidation)
🎯 Take Profit Targets
📌 TP1: $44.27 – Previous demand / support zone
📌 TP2: $43.15 – Strong support and target zone (green level)
📊 Risk-Reward Ratio Calculation
📉 Risk:
$45.98 - $45.20 = $0.78 risk per share
📈 Reward to TP1:
$45.20 - $44.27 = $0.93 (1.19:1 R/R)
📈 Reward to TP2:
$45.20 - $43.15 = $2.05 (2.63:1 R/R)
🔍 Technical Analysis & Strategy
📌 Triangle Breakdown: Bearish breakout from consolidation pattern
📌 Lower Highs: Selling pressure increasing, indicating weakness
📌 Volume Watch: Breakdown candle volume confirmation adds edge
📌 Red Zone Flip: Support at yellow line now acting as resistance
⚙️ Trade Execution & Risk Management
📊 Entry Confirmation: 30-min candle close below $45.20
📉 SL Placement: Above recent highs / invalidation zone = $45.98
🔁 Trailing Stop Strategy:
✔ Move SL to breakeven at TP1
✔ Trail stop down toward $43.50 as price moves toward TP2
💰 Partial Profit Booking Strategy
✔ Book 50% profits at TP1 = $44.27
✔ Hold remainder toward TP2 = $43.15
✔ Protect profits by tightening SL on the way down
⚠️ Setup Invalid Conditions
❌ Close above $45.98 = pattern failed
❌ Lack of breakdown volume = avoid entry
🔻 Final Thoughts
✔ Breakdown from wedge + trendline breach = bearish confirmation
✔ Clean downside structure with solid 2.6:1 R/R
✔ High-probability short setup if support fails with volume

ON Semiconductor Corporation (ON) – 30-Min Long Trade Setup!### 📌 ** 🚀**
🔹 **Asset:** ON Semiconductor Corp (**ON** – NASDAQ)
🔹 **Timeframe:** 30-Min Chart
🔹 **Setup Type:** **Symmetrical Triangle Breakout**
---
### **📊 Trade Plan (Long Position)**
✅ **Entry Zone:** Above **$43.24** (Breakout Confirmation)
✅ **Stop-Loss (SL):** Below **$42.11** (Key Support Level)
🎯 **Take Profit Targets:**
📌 **TP1:** **$44.49** (First Resistance Level)
📌 **TP2:** **$46.07** (Extended Bullish Move)
---
### **📊 Risk-Reward Ratio Calculation**
📉 **Risk (SL Distance):**
$43.24 - $42.11 = **$1.13 risk per share**
📈 **Reward to TP1:**
$44.49 - $43.24 = **$1.25** (**1:1.10 R/R**)
📈 **Reward to TP2:**
$46.07 - $43.24 = **$2.83** (**1:2.50 R/R**)
---
### **🔍 Technical Analysis & Strategy**
📌 **Symmetrical Triangle Breakout:** Price is breaking above **trendline resistance**, signaling bullish momentum.
📌 **Key Resistance at $44.49:** Needs to **clear this level** for further upside to TP2.
📌 **Volume Confirmation Needed:** Ensure **above-average volume** above **$43.24** to validate breakout.
📌 **Support at $42.11:** A break below this invalidates the trade setup.
---
### **📉 Trade Execution & Risk Management**
📊 **Volume Confirmation:** Look for **strong bullish volume** above **$43.24** before entering.
📉 **Trailing Stop Strategy:** Move SL to **entry ($43.24)** after TP1 is hit.
💰 **Partial Profit Booking Strategy:**
✔ Take **50% profits at $44.49**, let the rest run toward $46.07.
✔ Adjust **Stop-Loss to Break-even ($43.24)** after TP1 is reached.
---
### **⚠️ Fake Breakout Risk**
❌ If price **fails to hold above $43.24**, exit early.
❌ Wait for a **30-min candle close** above the breakout level before entering.
---
### **🚀 Final Thoughts**
✔ **Bullish Setup** – Strong breakout potential.
✔ **Momentum Shift Possible** – Watch for **volume confirmation**.
✔ **Favorable Risk-Reward Ratio** – **1:2.50** to TP2.
💡 **Stick to the plan, manage risk, and trade smart!** 🚀📈
🔗 **#ONStock #NASDAQ #SwingTrading #TradingView #ProfittoPath** 💰📊

ON/USD – 30-Min Long Trade Setup !📌 🚀
🔹 Asset: ON (ON Semiconductor Corporation)
🔹 Timeframe: 30-Min Chart
🔹 Setup Type: Bullish Reversal Trade
📌 Trade Plan (Long Position)
✅ Entry Zone: Above $45.84 (Breakout Confirmation)
✅ Stop-Loss (SL): Below $44.79 (Invalidation Level)
🎯 Take Profit Targets:
📌 TP1: $48.15 (First Resistance Level)
📌 TP2: $50.91 (Extended Bullish Move)
📊 Risk-Reward Ratio Calculation
📉 Risk (SL Distance): $45.84 - $44.79 = $1.05 risk per share
📈 Reward to TP1: $48.15 - $45.84 = $2.31 (1:2.2 R/R)
📈 Reward to TP2: $50.91 - $45.84 = $5.07 (1:4.8 R/R)
🔍 Technical Analysis & Strategy
📌 Downtrend Breakout: Price has broken out of a falling trendline, signaling a bullish reversal.
📌 Support Rejection: The price bounced off $44.79 support, showing buyer strength.
📌 Volume Confirmation Needed: Ensure high buying volume when price holds above $45.84 to confirm bullish momentum.
📌 Momentum Shift Expected: If price remains above $45.84, it could push toward $48.15, and further to $50.91.
📊 Key Support & Resistance Levels
🟢 $44.79 – Stop-Loss / Support Level
🟡 $45.84 – Breakout Level / Long Entry
🔴 $48.15 – First Resistance / TP1
🔴 $50.91 – Final Target / TP2
📉 Trade Execution & Risk Management
📊 Volume Confirmation: Ensure high buying volume above $45.84 before entering.
📉 Trailing Stop Strategy: Move SL to entry ($45.84) after TP1 ($48.15) is hit.
💰 Partial Profit Booking Strategy:
✔ Take 50% profits at $48.15, let the rest run toward $50.91.
✔ Adjust Stop-Loss to Break-even ($45.84) after TP1 is reached.
⚠️ Fake Breakout Risk
❌ If the price fails to hold above $45.84 and drops back, exit early to avoid losses.
❌ Wait for a strong bullish candle close above $45.84 before entering aggressively.
🚀 Final Thoughts
✔ Bullish Setup – Bouncing from $44.79 support suggests a potential reversal.
✔ Momentum Shift Possible – Watch for volume confirmation.
✔ Favorable Risk-Reward Ratio – 1:2.2 to TP1, 1:4.8 to TP2.
💡 Stick to the plan, manage risk, and trade smart! 🚀📈
🔗 Hashtags for Reach & Engagement:
#StockMarket 📉 #ON 📊 #TradingNews 📰 #MarketUpdate 🔥 #Investing 💰 #Trading 📈 #Finance 💵 #ProfittoPath 🚀 #SwingTrading 🔄 #DayTrading ⚡ #StockTrader 💸 #TechnicalAnalysis 📉 #EconomicNews 🏛️ #FinancialFreedom 💡 #MarketTrends 📊 #StockAlerts 🔔 #TradeSmart 🤓 #Bullish 🐂

$ON with a bullish outlook following its earnings #StocksThe PEAD projected a bullish outlook for NASDAQ:ON after a negative under reaction following its earnings release placing the stock in drift D with an expected accuracy of 66.67%.

On Semiconductor Corporation (ON) SL-$54,65 TP-$57,90Technical Analysis:
Accumulation with compression in the equilibrium zone
Technical magnet pulling the price upwards
Gap to be filled

ON Semi is fundamentally undervalued and ready for a reversalTechnical View
NASDAQ:ON ON bounce off from a bigger support area from 2022 at around $53 building an ascending triangle. We have a gap above our current price (which can function as a magnet for the stock price). A smaller resistance at $60 might be our first target and the bigger resistance at $77 could be our final target resulting in 36% ROI. The trade would be invalidated below $50. Since this is a bigger swing trade, I would not put my SL to close to the current stock price. If you’re interested why this is a mid- to long-term swing trade read the fundamental information below.
Support Zones
$50-53
Target Zones
$60
$77
Fundamental View
ON Semiconductor concluded the third quarter of 2024 with revenue amounting to $1,762 million, reflecting a 2% increase from the second quarter but a -19.2% year-over-year decline. Nevertheless, the revenue for the quarter exceeded the consensus estimate by 0.70%. The most significant revenue losses were observed in the industrial end-market, with figures reaching $439.90 million compared to the average estimate of $464.97 million, marking a -28.6% decrease.
The gross margin experienced a 2% improvement, now constituting 45.4% of total revenue. Looking ahead, the acquisition of GlobalFoundries’ New York plant is anticipated to enhance the company's chip production capabilities. This facility is expected to maintain consistent production costs while simultaneously increasing production efficiency, in anticipation of a future rise in demand.
The stock has decreased by 11.26% on a year-to-date basis, with a reported trailing twelve months (TTM) earnings per share (EPS) of $4.03. Management has reported having over $1 billion in free cash flow and plans, according to Barron’s, to utilize half of each quarter’s cash flow to repurchase shares under onsemi’s Share Repurchase Program. The reduction in investments will contribute to increasing free cash flow margins, thereby reinforcing OnSemi’s objective of returning 50% of free cash flow to investors. This, combined with a projected slight improvement in sales growth and profitability, is expected to elevate EPS to $7.11 by 2027.
Currently, the company's valuation appears reasonable, trading at a forward price-to-earnings (P/E) ratio of 13.49, which is lower than 90% of the time over the past five years and significantly beneath the S&P 500 P/E ratio as well as the industry median P/E of 25.4. Based on analysts' projections for EPS and maintaining a steady P/E ratio, the company is anticipated to reach a price of $95.91 within the next two years. While this scenario may seem overly optimistic, it is evident that the market is currently undervaluing the stock, especially when compared to its main competitors, such as Texas Instruments and Analog Devices.
Since EV is a superior trend I don’t think Trumps political decision will have an impact. In addition, “Vice President” Musk has a, let’s say, not so little interest in selling more EVs.

On Semiconductor: Underdog moat of AI power playOn Semiconductor
The company is currently trading at $56.26 per share at TTM Price-to-earning(P/E) ratio of 13.69, approximately, with a forward P/E ratio of 13.92.
The enterprise value to EBITDA (EV/EBITDA) is about 8.89, with profit margin of 23.8%.
Analysts’ consensus estimates for the upcoming quarter project earnings per share (EPS) between $0.92 and $1.04, with revenue expectations ranging from $1.7 billion to $1.8 billion.
Based on the estimates, the calculated intrinsic value of the forecasted share price lies between $52 to $57.9 range.
Focus Industries : Automotive, industrial, and IoT markets.
Strengths :
1. Leader of the product segment.
2. Growth in EV and ADAS solution.
3. Vertical integration mitigating supply chain risks and reaching operational efficiency.
4. Global operating segments - Optimism grown alongside with interest rate optimism tailwind.
Weakness :
1. Dependence on cyclical markets
2. Limited presence in certain high-growth segments
3. High CAPEX limiting shareholder return
Key Customers:
1. Tesla, GM, Ford, and other automotive manufacturers.
2. Dell, HP, and Cisco..
3. IoT companies and manufacturing organizations.

Falling wedge on $ON weekly chartLooking pretty bullish. Just cleared all the weekly VWAPs and EMA on today's close. Right at the volume shelf. Monthly still has some VWAPs to clear but I think over the next 4-6 months, this could be a great breakout play.
Bullish and am currently long.

On semiconductor monthly chatGood 4 short, medium and long term traders
First target 83.5$
Second target : 85$ & more 😉

if $NXPI can be up on its earning report, $ON can tooCFRA likes ON’s exposure to the industrial and automotive markets, about 80% of revenue,
which should support profit margins and better growth opportunities long term. That said, CFRA
sees near-term softness within certain industrial applications and inventory digestion within the
automotive space, similar to peers. Long term, CFRA remain optimistic about content gain
potential within the automotive space due to the electrification of the vehicle (EVs) and
Advanced Driver Assistance System (ADAS) adoption. CFRA see content growth partly
offsetting any potential automotive end demand weakness, while we expect SiC demand
to sharply outpace capacity growth (grew to $800M in 2023 from $200M in 2022; $2.5B
potentially in 2027). Given healthy free cash flow, we see more aggressive buybacks ahead
(new SEED_TVCODER77_ETHBTCDATA:3B authorization in February).

ON potential Buy setupReasons for bullish bias:
- Price gave triangle breakout
- Price bounce from support
- LH breakout
- No divergence
Here are the recommended trading levels:
Entry Level(CMP): 78.74
Stop Loss Level: 58.74
Take Profit Level 1: 98.74
Take Profit Level 2: 110.26
Take Profit Level 3: Open

ON 4.3:1 possible resurgence after November's dropNASDAQ:ON fell hard November 2023, we could see it rise to previous levels, firstly we can point out the main support at $60, the main resistance at around $87 and some around $75, I'm assuming an entry point at $62 or $61. My SL is right below the support at $57.8 and my TP at $83.3. Personally I would also sell a third of the shares at $75 just to lock in some of the profits and include a trailing stop loss somewhere below that. Of course we will see how things play out and I will keep this post updated as things play out.

ON potential Buy setupReasons for bullish bias:
- Price bounced from support
- Bullish Harmonic XABCD pattern
- Strong bullish candles at support
- Positive Earnings
Here are the recommended trading levels:
Entry Level(CMP): 73.58
Stop Loss Level: 67.16
Take Profit Level 1: 80
Take Profit Level 2: 85.99
Take Profit Level 3: Open

ON Semiconductor - betting on corrective UT rallyOn Semi conductor's selling has been weakened since Nov 23 and the larger falling wedge is pointing towards a larger bullish reversal pattern. First the cup and handle is close to a completion and will confirm the pattern once it breaks above US$72.84 resistance.
Volume is low but is a potential sign of accumulation. Long-term MACD is close to a bottom crossover. Stochastic Oscillator is oversold. 23-period ROC shows bullish divergence.
Hence will consider buying at spot or wait for pullback at 65.13 support. Target is at 79.85 and 98.54.

ON Semi - possible ABC correctionON semi pattern is a bit sceptical. The stock was in a super uptrend peaking at ATH 111+ tested 87-89 area, broke out to 111, but quickly reversed in few weeks and again couple times tested the same resistance of 87-89.
Assuming 111 was an end of wave 5, as we did not have other highs tested, we are now in a serious ABC correction shaping a H&S pattern as tentatively indicated in the chart. Fairness sake would not presume it’s a true H&S, as there is no boost in volume on red candles of the right shoulder as well as the height of a neckline should bring the stock in theory down to 8 what either makes no sense.
Out of ABC correction wave (A) reversed fibo 0.768 of wave (5) ending at neckline 61.50, then wave (B) retraced 0.5 of wave (A) to 87 resistance mentioned above. Hence, correction wave (C) should be as long as either 25 (fibo 0.5 W(A)), or 31 (fibo .618 W(A)). The former brings us to 62, while the latter matches the H&S hypothetical neckline of 56. I wonder to see if it tests 56 and if it does break, then it’s not an ABC correction of the uptrend, but a downtrend as such and we are in wave (3) of the downtrend!
