Car related Semiconductors supply metJust passing along a news headline I read last week. It said that the auto industry has finally caught up with the demand from auto-related semi chips.
Remember when GM couldn't release anymore SUV's until it found chips for the AC units?
ON Semi could've well been the supplier. But now that demand has softened, and supply is more plentiful, what does it mean for this company?
I haven't analyzed their balance sheet but I'm willing to bet there's nothing in there to make you pay up now for a semi chip company isn't in the spotlight anymore. They cater to other industries, yes, but auto is their bread and butter.
I'm not saying it's a bad company because it isn't, the macro situation just doesn't do it justice right now. What for sub $50 to buy this stock again.
1ON trade ideas

ON: Potential BuyPrice has broken the downwards trend line with very bullish momentum. I'm expecting the upside to continue backed with positive analyst expectations.

$ON poised to fill the upside gap...Update: NASDAQ:ON +177% since the start of 2020. Signal comes back in line at 73.32 and fills the gap at 80.51. I would look at an upward retrace to the 0.5 (81.38) the same as an upside gap fill.
Given the depth of oversold on the 1D RSI in combination with an extremely high central tendency illustrated by the Pearson's R^2 of 0.94, a 'dead cat bounce' to the upside is not unreasonable to expect in the near term.
As long as price remains above the RET 1 (61.47) I believe NASDAQ:ON will retrace the 0.5 at 81.38 by the end of the year.
If price does not remain above the 61.47 level and further selling pressure is applied to the 'EV economy', a spill down to the 1.382 (46.26) is not out of the question.
130 day volume index flows (bottom indicator) remain constructive despite the recent sell off, implying a market willingness to absorb price at these levels.
Not financial advice. All stocks can go to zero.

On Onsemi SemiconductorComing off oversold and making a bounce at a trendline established in March of 2020. Financials look good. Future EV and Electonics looks to become more prevalent. Onsemi may bounce back nicely from its recent sell off. Probably in the range of $77 and $80 where there was prior activity.

$ON: The EV downside is already priced in.$ON:1D
With the earnings forecast providing downside price pressure on the longterm trend, NASDAQ:ON hits the lowest level on its1D RSI in over two years.
Needless to say, our trend has been weakened from a Pearson’s R^2 of 0.91 down to a Pearson’s R^2 of 0.88 while losing a little more than 3% of the longterm trend strength in the process.
While there are significant headwinds facing the EV market at current, from supply constraint’s on graphite to scaling EV’s across our shaky electrical grid system, it seems as though NASDAQ:ON has those concerns ‘overly priced in’ and could be poised for a rebound along with the broader semi-conductor market.
I would expect NASDAQ:ON to make an attempt at coming ‘back in line’ with its long term trend and to make a move up to the lower 3rd standard deviation line at 76.49 and possibly higher before year’s end.
Not financial advice. All stocks can go to zero.

$ON: EV headwinds are priced in.$ON:1D
With the earnings forecast providing downside price pressure on the longterm trend, NASDAQ:ON hits the lowest level on its1D RSI in over two years.
Needless to say, our trend has been weakened from a Pearson’s R^2 of 0.91 down to a Pearson’s R^2 of 0.88 while losing a little more than 3% of the longterm trend strength in the process.
While there are significant headwinds facing the EV market at current, from supply constraint’s on graphite to scaling EV’s across our shaky electrical grid system, it seems as though NASDAQ:ON has those concerns ‘overly priced in’ and could be poised for a rebound along with the broader semi-conductor market.
I would expect NASDAQ:ON to make an attempt at coming ‘back in line’ with its long term trend and to make a move up to the lower 3rd standard deviation line at 76.49 and possibly higher before year’s end.
Not financial advice. All stocks can go to zero.

Stocks pairs trading: LSCC vs ONIn the semiconductor sector, Lattice Semiconductor (LSCC) and ON Semiconductor (ON) offer contrasting financial metrics and growth prospects. Going long on LSCC and short on ON could capitalize on their differences, aiming for a reversion to their historical performance relationship.
Why Go Long on Lattice Semiconductor (LSCC):
Valuation: LSCC has a higher P/E of 47.88 compared to ON's 19.15, often an indication that the market expects higher growth prospects from LSCC. Additionally, LSCC's forward P/E of 28.53 signals that the market is expecting the earnings to improve in the near future.
Profitability: LSCC has an ROA of 27.38% and an ROE of 40.53%, which are both higher than ON’s figures of 16.60% and 31.59%, respectively. This indicates better utilization of assets and equity for LSCC. The expected EPS growth for the next year for LSCC is 17.96%, which is more than double ON's expected 8.33%.
Performance Metrics: Despite recent short-term declines, LSCC has had a strong Perf Year of 38.90%, making it a candidate for a potential rebound.
Why Short ON Semiconductor (ON):
Valuation: While ON’s current P/E of 19.15 is lower, its forward P/E of 14.76 may not show as much expected growth in earnings as LSCC, given that ON's current P/E is already lower than LSCC's forward P/E.
Short Interest: ON has a short float ratio of 5.49%, indicating some level of negative sentiment, which could support a short position.
Profitability: Although ON has healthy profitability metrics, they are generally lower than LSCC's. An ROA of 16.60% and ROE of 31.59% don't measure up to LSCC’s robust figures.
Performance Metrics: ON has seen negative trends in the Perf Week, Perf Month, and Perf Quarter metrics, which may reinforce the short position.
Decision:
Long on 1 LSCC
Short on 1 ON

does the ON the bullish trend continue👁👀very strong trend since May 2023, sitting right at support now. Bounce here and we rally to 111-114 resistance area.
also a very strong RSI Support zone, boost and follow for more. thanks 💛

ON Entry, Volume, Target, StopEntry: with price above 105.35
Volume: with volume greater than 5.23M
Target: 110.55 area (this is an area, no guarantee it reaches this price, but you should be selling on the way up)
Stop: Depending on your risk tolerance; Based on an entry of 105.36, 102.77 gets you 2/1 Reward to Risk Ratio.
This LONG swing trade idea is not trade advice and is strictly based on my ideas and technical analysis. No due diligence or fundamental analysis was performed while evaluating this trade idea. Do not take this trade based on my idea, do not follow anyone blindly, do your own analysis and due diligence. I am not a professional trader.

ON Entry, Volume, Target, StopEntry: when price clears 89.84
Volume: with average daily volume
Target: 98 area
Stop: depending on your risk tolerance; 87.13 gets you 3/1 Risk/Reward.
This swing trade idea is not trade advice and is strictly based on my ideas and technical analysis. No due diligence or fundamental analysis was performed while evaluating this trade idea. Do not take this trade based on my idea, do not follow anyone blindly, do your own analysis and due diligence. I am not a professional trader.

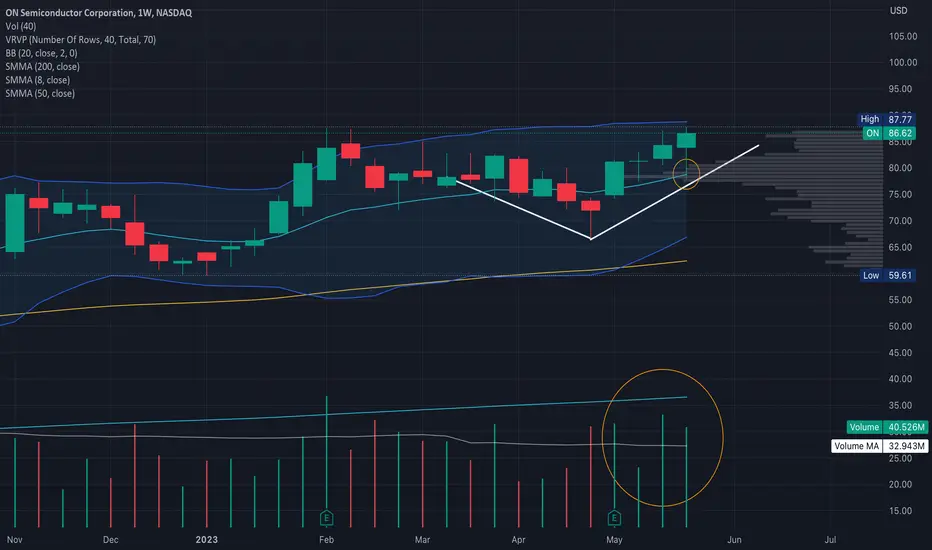
$ON BULLISH WEEKLY CHART!Let take a look at the recent weekly close. A nice simple base has formed. We see the price dropped to the 8 day ma at $78.60 but ate all the way up to $86.50 and closed near the weekly high. The indicates great strength to me. Institutional buying seen here with the above average volume. Your chance to get in was at $78.60, maybe I'll get in on a break of $90. Do your own homework before investing in stocks.
ON - RisingTrend Channel [MID TERM]- ON is in a rising trend channel in the medium long term.
- ON has broken a resistance level and given a positive signal for the long-term trading range.
- In case of a negative reaction, the stock has support at approximately 76.00 .
*EP: Enter Price, SL: Support, TP: Take Profit, CL: Cut Loss, TF: Time Frame, RST: Resistance, RTS: Resistance to be Support LT TP: Long Term Target Price
*Chart Pattern:
DT - Double Top | BEARISH | RED
DB - Double Bottom | BULLISH | GREEN
HNS - Head & Shoulder | BEARISH | RED
REC - Rectangle | BLUE
iHNS - inverse head & Shoulder | BULLISH | GREEN
Verify it first and believe later.
WavePoint ❤️

ON BREAKOOUT BUYGREAT R/R if breakout happen on god name ow risk
great market conditions if market follows this stock is $$$

ON - Rising Trend Channel [MID TERM]- ON is in a rising trend channel in the medium long term.
- The stock has broken up through resistance at 76.00.
- In case of negative reactions, there will now be support at 76.00.
- The stock is assessed as technically positive for the medium long term
*EP: Enter Price, SL: Support, TP: Take Profit, CL: Cut Loss, TF: Time Frame, RST: Resistance, RTS: Resistance to be Support LT TP: Long Term Target Price
*Chart Pattern:
DT - Double Top | BEARISH | RED
DB - Double Bottom | BULLISH | GREEN
HNS - Head & Shoulder | BEARISH | RED
REC - Rectangle | BLUE
iHNS - inverse head & Shoulder | BULLISH | GREEN
Verify it first and believe later.
WavePoint ❤️

$ON push to new ATH?$ON is in a great symmetrical triangle.
It's in the lower portion of it and looks pretty good.
For upside I would like a hold of $76 and of course a hold of the bottom part of the triangle.
Targets around 90-92$.

Upcoming flag break to the upsideWith the recent strength in the market and semiconductors, I believe this is a high probability flag breakout to the upside

ON - Rising Trend [MIDTERM]- ON is in a rising trend channel in the medium long term.
- This signals increasing optimism among investors and indicates continued rise.
- ON is testing support at 75.
- This could give a positive reaction, but a downward breakthrough of 75 means a negative signal.
- The stock is assessed as technically positive for the medium long term.

$ON with a bullish outlook following its earnings #StocksThe PEAD projected a bullish outlook for $ON after a negative over reaction following its earnings release placing the stock in drift C with an expected accuracy of 50%.

$ON Technical Analysis: Yearly High Close, Trendline ResistanceYearly High Close
Price is close to the yearly highs.
Trendline Resistance
Daily price is touching a trendline resistance level. Price can hit the resistance level and start going down,
which would be a bearish signal. It can also break out of it to form a breakout, which would be bullish.
Pivot Machine Gun (PMG)
When price makes continued highs for 5 days. This is a bearish reversal signal
only if price starts to break the low of the last day's candle.
Pocket Pivot
The volume on the green candle today was higher than the volume on any red candles over the last few weeks.
This can signify institutional accumulation.
Stochastics Overbought
Stochastics value is above 80.
Wedge
Descending wedge. These are calculated base on last 3 monthly candles.
Therefore, they are best visible on the monthly and weekly chart.
$ON 3/17 Bullish

$ON Analysis, Key levels, and Targets $ON Analysis, Key levels, and Targets
ON is my Semi company…. I like this company. I can elaborate further in the next few days but I’m getting my list together…. This is on it, always. I like AMD as well but between the two I’d pick ON…
And if y’all know how to read my charts you know where I’m looking…

ON1Y
RSI is declining.
MFI is holding steady.
5Y
RSI is moving up.
MFI is declining.
ALL
RSI has overextended.
MFI is declining.
Prediction: We are going to be falling. There are some gaps around the $10-15 range.
For my educational purpose, not to be used as financial advice.

ON Semiconductor Corporation can provide further upside in 2023NASDAQ:ON was in a strong correlation with SP:SPX in the last years. To be accurate, the correlation was so strong between 2002 to 2021. However, since the beginning of this year, this correlation is not working anymore. In this bear market, the company has been providing price support and testing new high levels.
From a fundamental point of view, US needs to secure more domestic capability for semiconductor production. So, this company can provide more upside in the next year based on this new developing trend.

Early Thoughts for ONI am looking at $ON Semiconductor here for a potential move to the low $90 range. If the stock can hold strong over what I would call the "mode" in the mid $60s, it is fair to look at the $90 level as a realistic target. The stock has undergone a good bit of balance/consolidation in and around the mid $60 and looks to have a chance to make that breakout into all time highs. We will see over the coming days what the agenda is here, but I wanted to release my early thoughts. Looking forward to see how it plays out. I do have a position in the stock myself. Make sure to always size appropriately and trade safely!
Happy Thanksgiving week from the US and Best of Luck!
