While You Were Watching NVIDIA, Oracle Quietly Ate the BackendEveryone's chasing the AI hype but Oracle is one of the only companies selling the picks and shovels behind the scenes.
While headlines focus on NVIDIA, Meta, and ChatGPT, Oracle has been building the back-end massive AI-ready data infrastructure, hyper scale cloud partnerships, and GPU clusters feeding OpenAI and Nvidia workloads directly.
This isn’t some pivot or marketing gimmick Oracle Cloud Infrastructure (OCI) is quietly powering the largest LLMs in the world. And Wall Street is only beginning to price that in.
Why Oracle’s Move Is Just Getting Started
1. AI Cloud Infrastructure – Not Just Software
Oracle Cloud Infrastructure (OCI) is integrated directly into OpenAI, NVIDIA, Microsoft, and Cohere LLM workflows. Ellison confirmed that AI demand on Oracle’s cloud is now booked out for years, including custom GPU clusters. OCI outperforms AWS in specific AI workloads at a lower cost. That’s a disruptor narrative in itself.
2. Earnings Momentum + Smart Money Rotation
Oracle just printed double-digit YoY cloud growth, increased margins, and committed billions in CapEx classic early-growth behaviour. It’s now a value + AI hybrid, attracting funds rotating into defensible, profitable AI infrastructure plays.
3. Stage 2 Breakout – Repricing in Motion
ORCL broke above its 2021 all-time high ($188) with conviction. Stage 2 began around $195–200, with high volume + range expansion. This is a textbook Stage 2 expansion phase not a short squeeze, not a blow-off top. Monthly structure confirms 23+ years of consolidation is complete.
Technical Markup Summary
- Stage 2 Breakout Level - $195–200
- Support Zone (Prior ATH) - $185–190
- Volume Confirmation - Highest range + volume since Dotcom era
- Current Price Action - Early parabolic expansion = healthy trend
Projected Price Targets
- TP1 $275 Fib 1.618 + round number magnet
- TP2 $310–320 Revaluation zone if earnings accelerate
- TP3 $420+ AI AWS narrative fully priced in
Why This Isn’t a Late Entry
Most traders wait for headlines and miss the Stage 2 phase, which is where real money is made. Oracle is now being repriced for the role it’s actually playing in AI not just as a legacy tech name, but as a global infrastructure layer. This breakout isn’t the end it’s the beginning.
Oracle is no longer just “that enterprise database company.” It’s becoming a core infrastructure provider for the AI era, with multi-year demand, sticky revenue, and strong technical structure.
If you missed NVIDIA’s early breakout this may be your redemption arc.
Defined support at $190
Open runway to $275+
This is a swing-to-position hold for high-conviction players. What's your thoughts?
1ORCL trade ideas

ORACLE Can you foresee it at $2000??Oracle (ORCL) is having perhaps the most dominant recovery from Trump's Tariff lows out of the high cap stocks, trading comfortable on new All Time Highs.
This is no surprise to us, as like we've mentioned countless times on our channel, we are currently at the start of the A.I. Bubble and heavy tech giants are expected to see massive gains until 2032, where we've calculated the end of this Bull Cycle and the start of a strong Bear.
As mentioned, this situation is extremely similar to the Dotcom Bubble of the 1990s. Of course Oracle is nearly impossible to repeat the +38637% gains of that Golden Decade after the 1990 Oil Crisis but in Fibonacci price and time terms, it can technically complete a +3411% rise and hit $2000 in the next 7 years.
If you have a long-term investor mindset like us, this is a must stock to buy and hold.
-------------------------------------------------------------------------------
** Please LIKE 👍, FOLLOW ✅, SHARE 🙌 and COMMENT ✍ if you enjoy this idea! Also share your ideas and charts in the comments section below! This is best way to keep it relevant, support us, keep the content here free and allow the idea to reach as many people as possible. **
-------------------------------------------------------------------------------
💸💸💸💸💸💸
👇 👇 👇 👇 👇 👇

Weekly Stock Pick: ORCL Continues the Trek HigherHello Traders!
As part of my weekly equity trade analysis, I will be uploading my recordings of what I am seeing and intending to trade for the week. A quick summary of what's in the video is as follows:
- ORCL has been a headliner stock for the last couple months since its earnings, fueled by momentum in the Cloud AI and Services space
- Right now price action is in full on MOMO mode and trending towards its fibonacci extension levels of $265-$280. This is not the price action of ORCL of yesteryear
- We are expecting a retracement to resolve some imbalances, but to structurally hold key levels above the previous consolidated high of $241.44
- Our vehicle of choice this week are the $255 weekly calls with our entry being inside the highest daily order block. Our entry area is between $0.47 and $0.35. Our price target is $260
Cheers,
DTD
Financial Risk Disclaimer |
DISCLAIMER: I am not a financial adviser. The videos on my channel are for educational and entertainment purposes only. I'm just showing you guys how I invest and day trade, but remember, investing of any kind involves risk. Your investments are solely your responsibility and not mine. While day trading can bring substantial gains, it can also bring serious losses! So make sure you do your research to fully understand the market before diving in. The possibility exists that you could sustain a loss of some or all of your initial investment, and therefore should not invest money that you can't afford to lose. The fluctuation of the market can work for you or against you. You should carefully consider your investment objectives and experience before deciding to trade in the market. Again, what you invest in is solely your responsibility.

Safe Entry OracleStock In Up-Movement.
P.High (Previous High) is Safe Entry.
Note: 1- Potentional of Strong Buying Zone:
We have two scenarios must happen at The Mentioned Zone:
Scenarios One: strong buying volume with reversal Candle.
Scenarios Two: Fake Break-Out of The Buying Zone.
Both indicate buyers stepping in strongly. NEVER Join in unless one showed up.
2- How to Buy Stock (safe way):
On 1H TF when Marubozu/Doji Candle show up which indicate strong buyers stepping-in.
Buy on 0.5 Fibo Level of the Marubozu/Doji Candle, because price will always and always re-test the

Oracle: Out of Fuel Oracle (ORCL) just hit its limit. The bullish momentum is gone — RSI was over 70, Bollinger Bands were stretched, and there was no volume to back it up. No fuel left.
It’s now pulling back right from the 0% Fibonacci level, confirming the move. This looks like the start of a technical reversal.
Keep an eye on it.

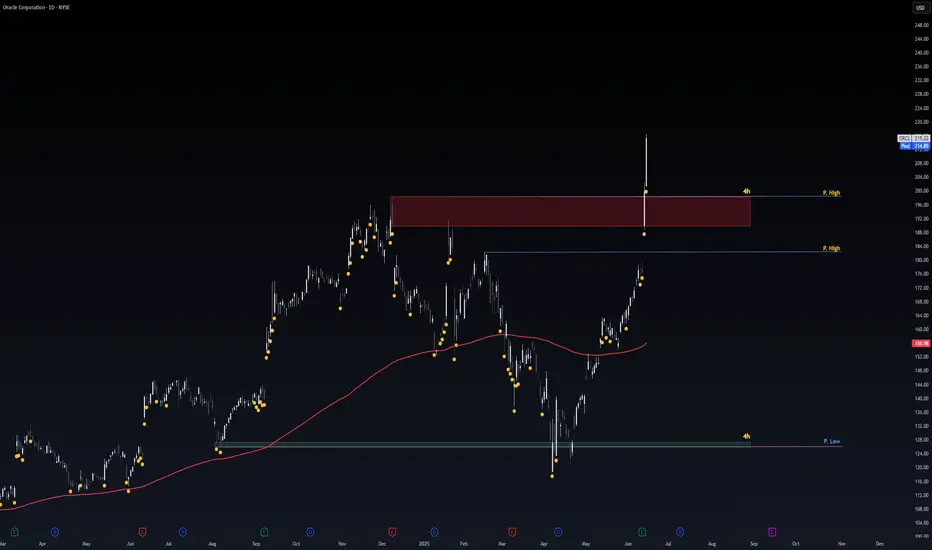
$ORCL Beats Earnings – Flat Base Breakout?There is a lot to like about NYSE:ORCL both on the chart and fundamentals. Not only did they beat earnings and now get an upgrade (see below), but the stock has also now formed a flat base after earnings. What that means to me is that buyers have pushed the stock up and there are not enough sellers to bring it back down.
I have an alert set at 215.01. If that triggers, I plan to open a full-sized position with a stop just under the most recent low (202.54). That is a 6% risk. Although, if it does not perform well right off the bat, I may close it on whatever day I open if it falls below the day low. All TBD.
If you like this idea, please make it your own and follow your trading plan. Remember, it is your money at risk.
Oracle rises as Stifel upgrades to 'buy'
** Stifel upgrades stock to "buy" from "hold", citing strong momentum in its Cloud business and disciplined cost management
** Increases PT to $250 from $180, implying an 18.91% upside to stock's last close
** "We believe Oracle is well positioned to accelerate total Application Cloud growth to the low teens range in FY26" - brokerage
Oracle Beat Expectations
Wednesday, June 11, 2025 at 4:05 PM ET
Oracle (ORCL) reported earnings of $1.69 per share on revenue of $15.90 billion for the fiscal fourth quarter ended May 2025. The consensus earnings estimate was $1.64 per share on revenue of $15.54 billion. The Earnings Whisper number was $1.66 per share. The company beat expectations by 1.81% while revenue grew 11.31% on a year-over-year basis.

Safe Entry Zone ORCLAfter Sudden Contract Deal.
Better to not follow the Stock and wait for re-trace.
P.High(Previous High) act As good support level to wait for Strong Buyers to Step-in.
Note: 1- Potentional of Strong Buying Zone:
We have two scenarios must happen at The Mentioned Zone:
Scenarios One: strong buying volume with reversal Candle.
Scenarios Two: Fake Break-Out of The Buying Zone.
Both indicate buyers stepping in strongly. NEVER Join in unless one showed up.
2- How to Buy Stock:
On 15M TF when Marubozu Candle show up which indicate strong buyers stepping-in.
Buy on 0.5 Fibo Level of the Marubozu Candle, because price will always and always re-test the imbalance.

ORACLE (ORCL) – Bullish Breakout AlertOracle is showing strong bullish momentum, breaking past its all-time high with solid volume confirmation. The price action signals continued strength, and if the momentum holds, we could be looking at a quick potential multibagger in the making.
🟢 Technically strong
📊 All-time high breakout
⚡ Momentum picking up
💰 Eyes on smart money inflow
Stay sharp and manage risk wisely. This could be a fast mover! 🔥
#Oracle #StockAlert #BreakoutStocks #Multibagger #ORCL #TechnicalAnalysis

Oracle (ORCL): Is a Pullback Coming?Hi Traders! I’m spotting something interesting on Oracle:
A sharp overnight sell-off left a price gap around $202, suggesting potential for a quick correction to fill that zone.
The RSI has dropped from overbought levels into a neutral zone near 50, signaling waning bullish momentum.
What to Watch:
Will ORCL tap that $202 gap soon?
Could the RSI stabilize at ~50 and resume upward, or continue south?
Is this a normal mid-week pause or the start of a deeper pullback?
What do you think?
Are we in for a gap-fill correction?
Or does this look like a healthy consolidation before another leg up?
Would love to hear your readings of the charts! What levels or indicators are you watching?

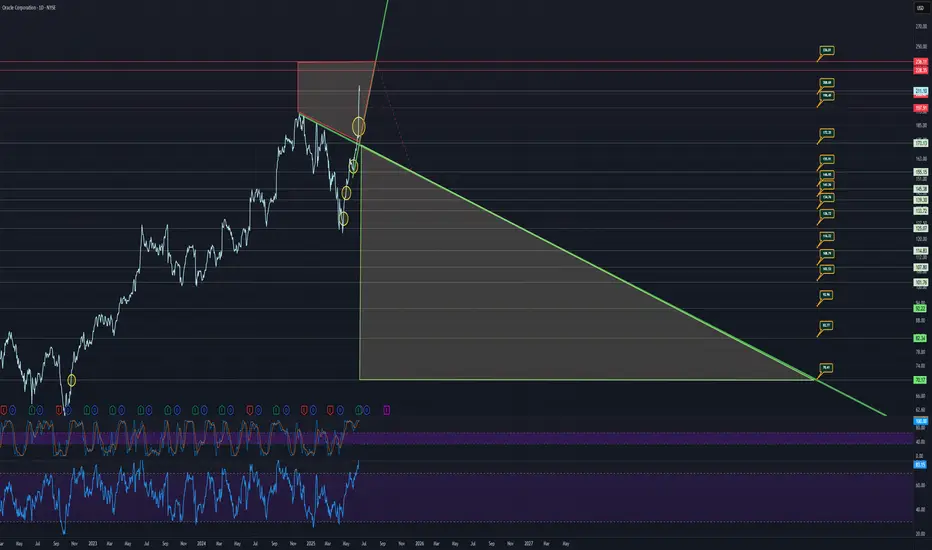
ORCL A POTENTIAL PIGGYStock Overview: Looks like Oracle Corporation is on the chart! We’re seeing a wild ride with some key patterns popping up.
Recent Trend: The stock’s been climbing steadily, but that shaded triangle (a descending wedge?) suggests a potential reversal or breakout. Keep an eye on it!
Resistance Level: That red line around 130-140 looks like a tough ceiling. Price has bounced off it a few times—might struggle to break through without strong momentum.
Support Zone: The green line sloping down shows a support trend. If it dips below, watch for a bounce around 100-110.
Indicators: Those lower charts (RSI and TRENDS) are wiggling a lot. RSI might be hinting at overbought conditions lately, so a pullback could be due.
Volume Check: Hard to tell without clear volume bars, but if volume spikes with a breakout above resistance, that’s a bullish sign!
My Take: This could go either way—breakout to new highs or a slide back to support. I’d wait for a clear move past 140 with volume to jump in, or a dip to 110 for a safer entry.
Next Steps: Let’s watch how it behaves this week (June 16, 2025). Want me to edit the chart or dig deeper? Just ask!
Careful, very few top side numbers left with lots of downside targets showing.
Price targets and trends marked on chart.
Follow for more charts like this.
ORCL at a Critical Zone: Will the Eagle Strike?
Oracle (ORCL) just completed a parabolic +20% move. Now it's flashing clear signs of exhaustion:
Bearish candle forming just below the EMA21
RSI spiked above 80 and is now curling down
Volume is fading while price stalls
Long upper wicks = visible selling pressure
This setup fits perfectly with my strategy: “The Eagle Trap” 🦅 — designed to catch short-term tops after euphoric rallies.
🔻 PUT thesis:
If price breaks below $212 with strong volume, targets are:
$208 → $202 → $198.
🎯 Invalidation:
If it reclaims $217 with heavy volume, the trade is off.
I don’t force trades — but I’m ready to strike if the breakdown confirms.
🔔 Follow me for real setups, weekly traps, and full strategy breakdowns.

$ORCL Overextended After Hitting 423.6% Fib ExpansionOracle had a post earnings run up not ever seen before in the Companies history. As of now price has moved up nearly ~$100 since the April 8th lows, and now sit at the 423.6% expansion level off a 78.6% retracement. Time to look for Oracle to come in.

Oracle (ORCL) shares surge 24% in a week, hitting all-time highOracle (ORCL) shares surge 24% in a week, hitting an all-time high
Last week, Oracle (ORCL) shares:
→ rose by approximately 24% — marking the strongest weekly gain since 2001;
→ broke through the psychological level of $200 per share;
→ reached an all-time high, with Friday’s session closing above $215. It is possible that a new record may be set this week.
What’s driving Oracle (ORCL) shares higher?
The main catalyst was the quarterly earnings report released last week:
→ Earnings per share ($1.70) exceeded analysts’ expectations ($1.64);
→ CEO Safra Catz projected revenue growth of 12–14% in upcoming quarters;
→ Company founder Larry Ellison highlighted “astronomical” demand for data centres, as well as Oracle’s competitive edge in building and servicing them.
Notably, Oracle provides infrastructure services for both OpenAI and Meta Platforms.
Technical analysis of ORCL shares
ORCL shares have shown high volatility throughout 2025, largely influenced by news surrounding Donald Trump. His promises to strengthen the US position in AI served as a bullish signal, while plans to impose international trade tariffs had a bearish impact.
As a result, a broad upward channel has formed on the chart, with the following key observations:
→ the price has repeatedly bounced sharply from the lower boundary (1), indicating strong demand;
→ by early June, the price had risen and stabilised near the channel’s median line (2).
Currently, the ORCL chart shows that the earnings-driven rally has pushed the price into the upper quartile (3) of the channel.
With the RSI indicator at extreme highs, it is reasonable to assume that ORCL may be vulnerable to a pullback. However, if a correction does occur, it is unlikely to be deep — perhaps testing the psychological $200 level — given the company’s strong fundamentals.
This article represents the opinion of the Companies operating under the FXOpen brand only. It is not to be construed as an offer, solicitation, or recommendation with respect to products and services provided by the Companies operating under the FXOpen brand, nor is it to be considered financial advice.

Oracle Just Frickin Exploded ....What the Hell Just Happened?!!When you hear the name Oracle, what comes to mind?
Chances are, you're thinking of old-school databases, big enterprise contracts, or maybe Larry Ellison’s yacht. And you're not wrong — Oracle has been a software giant for decades. But behind the legacy, there’s a transformation underway that’s catching serious investor attention:
Oracle is becoming one of the most quietly powerful cloud infrastructure players in the AI boom.
So the real question smart investors should be asking right now isn’t:
“Is Oracle still relevant?”
It’s this:
“Is Oracle still a smart investment at this price?”
As a value investor who combines deep fundamental analysis with AI-powered tools, I’m going to walk you through a comprehensive breakdown of Oracle from a true value lens — one that cuts through the noise and gets to the numbers that actually matter.
Whether you're learning how to value a stock or looking for your next long-term compounder, this guide will change how you see companies like ORCL.
Let’s dive in.
🧩 First: What Even Is Oracle?
To understand whether Oracle is a good buy, you first need to understand what it actually does — and how it’s reinventing itself in the AI era.
👇 TL;DR – Oracle in 3 Sentences:
💲It builds the databases that power much of the world’s enterprise software and runs mission-critical infrastructure for governments and companies.
💲It’s pivoting fast into cloud computing — and now claims cloud growth of over 70%, driven by demand from AI startups and enterprises alike.
💲With nearly 80% of its revenue coming from recurring cloud services, Oracle is quickly becoming an AI-first infrastructure provider.
Oracle isn’t just the old guard anymore — it’s quietly competing with AWS and Azure for the future of cloud.
🧠 Understanding Value: What Makes a Stock Undervalued or Overvalued?
Before we talk stock prices, let’s clarify something:
Value investing isn’t about buying cheap stocks.
It’s about buying great businesses for less than they’re worth.
To determine whether Oracle is undervalued or not, I ran it through six institutional-grade valuation models — then created a weighted average fair value to account for both opportunity and risk.
These models include:
✅ Discounted Cash Flow (DCF)
✅ Price-to-Earnings Multiples
✅ PEG Ratios
✅ Graham Formula
✅ Dividend Discount Model
✅ Forward Earnings Forecasts
Let’s walk through them — simply and clearly.
💵 Market Snapshot (as of June 14, 2025)
🔹 Current Stock Price: $215.22 (All-time high)
🔹 Consensus Analyst Target: ~$230–240 (some stretch targets at $275)
🔹 My Fair Value Estimate (weighted model): $217.50
🔹 Upside Potential: ~1% base case, with a bull case of ~28%, bear case of -5-10%.
📊 Let’s Break Down the Valuation Models — One by One
1️⃣ Discounted Cash Flow (DCF)
This model asks:
“How much cash will Oracle generate in the future — and what is that worth today?”
Assumptions:
- Revenue grows at ~11% CAGR
- 10% discount rate
- Terminal growth at 2%
Fair Value from DCF: $235.00
2️⃣ P/E Multiples (Price-to-Earnings)
We look at how much investors are paying per dollar of earnings — adjusted for Oracle’s industry average.
Fair Value from P/E: $220.00
(Oracle trades near 19× earnings vs. industry ~20×)
3️⃣ Forward P/E Valuation
Forward P/E accounts for future earnings projections — critical for growth pivots like Oracle’s cloud expansion.
Fair Value from Forward P/E: $240.00
4️⃣ Graham Formula
Ben Graham’s method values a company based on conservative earnings and growth expectations.
Fair Value from Graham Formula: $200.00
5️⃣ PEG Ratio (Price/Earnings/Growth)
A PEG near 1.0 means the price matches growth. Oracle’s growth-adjusted valuation looks compelling.
Fair Value Estimate from PEG: $250.00
6️⃣ Dividend Discount Model (DDM)
Oracle pays a dividend, but it’s modest. This model gives a lower valuation since most profits are reinvested.
Fair Value from DDM: $180.00
📊 Final Verdict: Weighted Average Fair Value = $217.50
At a current price of $215.22, Oracle is fairly valued — with more upside if growth exceeds expectations. BUT, I'd 100% wait for a pull-back.
⚖️ How I Weighed the Models (And Why It Matters)
Some valuation models work better for mature dividend payers. Others capture future growth. For Oracle — which straddles both — we need a balanced lens.
Here’s how I weighed the models:
🔹 Discounted Cash Flow (25%)
Oracle’s predictable cash flows and stable margin profile make DCF highly reliable.
🔹 Price-to-Earnings (20%)
Solid earnings and long-term contracts make the P/E model effective here.
🔹 Forward P/E (15%)
We factor in strong earnings guidance and cloud growth momentum.
🔹 Graham Formula (15%)
Good for conservatively modeling a legacy-heavy but evolving business.
🔹 PEG Ratio (15%)
Captures Oracle’s accelerating cloud growth and valuation premium.
🔹 Dividend Discount Model (10%)
Minor weighting — the dividend is nice but not central to the investment thesis.
Result: A composite valuation of $217.50 — right around current prices, but with a stretch case closer to $275.
📚 Book Value Growth: Quiet Compounding in Action
Oracle’s Book Value Per Share (BVPS) is often overlooked — but it's telling a quiet growth story.
Here’s how it’s evolved:
🔹 2020: ~$52
🔹 2024: ~$80
🔹 5-Year CAGR: ~11%
If this trend holds, BVPS could reach $142 by 2029.
At the current P/B ratio of 2.7×, that implies a future price target of ~$384 — long-term investors, take note.
This isn’t just noise. It’s what compounding looks like beneath the surface.
🔍 The Metrics That Matter
Here’s what’s driving my conviction:
🔹 P/E Ratio ~19× — Slightly below industry average. Not overvalued.
🔹 Forward P/E ~18× — Sign of efficient earnings growth.
🔹 ROE ~25% — A solid return on shareholder equity.
🔹 Debt/Equity ~1.2× — Manageable leverage, not excessive.
🔹 PEG Ratio ~1.3× — Growth-adjusted value looks reasonable.
🔹 Free Cash Flow: $20.8B — Plenty of ammo for buybacks, dividends, or reinvestment.
🔹 Cloud Revenue Growth: Expected to surge 40–70% next year.
This isn’t a sleepy old tech company anymore. Oracle is moving — fast.
📰 What’s Happening Right Now?
🔹 Q4 FY2025 Beat: $15.9B revenue (+11%), EPS beat
🔹 FY2026 Outlook: $67B revenue target, cloud growth >70%
🔹 Stock Surge: +29% YTD; +14.5% in a single day — best in 3 years
🔹 Record RPO: $138B — 41% YoY growth, signaling backlog strength
🔹 Some Analysts Cautious: Concerned about margin pressure and stretched valuations
Oracle is executing. But it's also priced for near-perfection — which means entry timing matters.
📈 Technicals: What Do the Charts Say?
Even fundamental investors should watch the chart.
🔹 Pattern: Inverse head & shoulders breakout
🔹 RSI: Overbought (~85) — signals short-term overheating
🔹 Support Levels: $180 and $154 — key zones to buy on dips
🔹 Next Resistance: ~$275 — stretch target on breakout continuation
🔹 Momentum: Strong buy signals from moving averages
📌 Recommendation: Wait for pullbacks between $180–200 for best risk/reward.
🧠 Bottom Line: Should You Buy Oracle?
Let’s be real:
Oracle isn’t flashy — but it’s doing something very rare:
✅ Accelerating growth in a legacy business
✅ Winning cloud infrastructure deals in the AI race
✅ Generating enormous cash flow
✅ Reasonably priced vs. peers
If you want exposure to AI infrastructure without the megacap premiums of NVIDIA or Microsoft — Oracle might be the play. It’s not undervalued by much, but pullbacks offer a great long-term entry. Disclaimer: this is for informational purposes only. Do your own due diligence.
🚀 Want To Analyze Stocks Like This Without Doing All the Math?
I built Wallstreet Alchemist AI to help investors cut through hype and analyze real value — using the same models I use professionally.
🎯 Try it for free (LINK IN PROFILE) — and let AI do the math, so you can focus on conviction.

ORCL SELL SELL SELL NEVER EVER EVER EVER UNDER ANY CIRCUMSTANCE DO YOU BUY A STOCK WITH AN 89 RSI!!! NEVER ORCL is a strong sell here, once it corrects it might be a buy again based off the blowout earnings and forecasts. But today, we be way ahead of ourselves boys and girls. We should easily retrace to fib .5 $184.35 and next Fib .618 $176.91 possibly a complete gap fill in coming days/ weeks but no matter what the pumpers say it's not a buy here!!!!! Today

Good Entry Zone OracleStock in Up Movement.
A Safe Entry would be Re-test the Red Zone which will act as Strong Support level.
Stock Showing Significant Up-Movement.
We have two scenarios must happen at The Mentioned Zone:
Scenarios One: strong buying volume with reversal Candle.
Scenarios Two: Fake Break-Out of The Buying Zone.
Both indicate buyers stepping in strongly. NEVER Join in unless one showed up.
2- How to Buy Stock:
On 15M TF when Marubozu Candle show up which indicate strong buyers stepping-in.
Buy on 0.5 Fibo Level of the Marubozu Candle, because price will always and always re-test the imbalance.
ORCL heads up at $212 then 220: Double Golden Fibs may STOP runORCL has been flying off the last Earnings report.
About to hit DUAL Golden fibs at $212.67-220.21
Ultra-High Gravity objects in its price-continuum.
It is PROBABLE to consolidate within the zone.
It is POSSIBLE to reject and dip to a fib below.
It is PLAUSIBLE but unlikely to blow thru them.
.
My last Plot that caught the BreakOut EXACTLY:
=================================================
.

ORACLE break All Time HighORACLE break All Time High
This stock has had a big move up after the sharp drop of the month of April this year.
This stock broke above ATH yesterday.
Is this a sustainable push-up?
Share your thought

ORCL IS A SELL SELL SELL HERE! way overbought!ORCL sell the news on this rally! Breached an all time high running out of steam. As most traders know a new ATH is heavy resistance, and we usually "check back" underneath this level once breaching in some cases they will go higher (after a correction). This combined with screaming overbought indicators name your favorite, it's a SELL. First target is $183.64 then it should fall below $183. I would not be surprised to see a complete gap fill before this can print another new ATH

ORCL Earnings Play – Riding AI Momentum (2025-06-11)📈 ORCL Earnings Play – Riding AI Momentum (2025-06-11)
Ticker: NYSE:ORCL (Oracle Corp)
Event: Earnings Report — 📆 June 11, After Market Close (AMC)
Bias: ✅ Moderately Bullish | Confidence: 70%
Strategy: Call Option | Expiry: June 13, 2025
🔍 Market Snapshot
📍 Price: Trading near recent highs
📈 RSI (Daily): 87.66 — Extremely overbought
📊 IV Rank: 0.75 → Implied volatility is high
📦 Options Market: Bullish skew; max pain at $170 suggests risk, but not dominant
🧠 Narrative Drivers: AI/cloud strength, institutional accumulation, strong uptrend
🧠 AI Model Consensus Summary
✅ Bullish (3/4 Models):
• Grok/xAI, Llama/Meta, Gemini/Google → all recommend a long call
• Favor upside potential due to strong trend + favorable sentiment
• Strike debate: $195 vs. $200 → $200 favored for cost/leverage
⚠️ Bearish (1/4 Models – DeepSeek):
• Flags overbought RSI + $170 max pain
• Recommends buying puts (contrarian sell-the-news play)
✅ Recommended Trade Setup
🎯 Direction: CALL
📍 Strike: $200
📅 Expiry: 2025-06-13
💵 Entry Price: $0.86
🎯 Profit Target: $1.00 (+16%)
🛑 Stop Loss: $0.25 (–71%)
📈 Confidence: 70%
⏰ Entry Timing: Before earnings close
📏 Size: 1 contract (limit to ~1% of capital)
⚠️ Risk Factors
• ❗ Binary Event: IV crush or weak results can kill premium
• 🧊 RSI > 87 → potential for short-term correction
• 🔁 If no move materializes, you may lose full premium
📣 Will NYSE:ORCL deliver an AI-fueled beat or flop on IV crush?
💬 Share your take ⬇ | Follow for daily earnings plays and AI-backed trade alerts.

Oracle Financial Outlook and Strategic Analysis (June 2025)
📈 Robust Growth Amid Strategic Shifts
Oracle Corporation has solidified its position as a leader in enterprise software and cloud infrastructure, with a strategic pivot toward AI and cloud computing. Over the past five years (2020–2024), Oracle has shown consistent financial growth, driven by its Oracle Cloud Infrastructure (OCI) and recurring revenue streams. Key financial metrics from 2024 highlight its strength:
Revenue Growth: From $39.07B in 2020 to $52.96B in 2024, Oracle has achieved a CAGR of ~7.9%, fueled by cloud subscriptions and software support contracts.
Net Income Surge: Net profits reached $10.467B in 2024, up 23% from 2023 ($8.50B), reflecting improved operational efficiency.
Free Cash Flow (FCF): Oracle generated $11.807B in FCF in 2024 (from $9.62B in 2020), with a 22% FCF margin, showcasing its ability to fund investments while returning value to shareholders.
EBITDA Margin: At 28.08% in 2024 (up from 26.5% in 2020), Oracle maintains strong profitability.
Return on Equity (ROE): A remarkable 120% in 2024, driven by a low equity base due to aggressive stock buybacks.
Shareholder Returns: Oracle paid $2.44/share in dividends and repurchased significant shares, with buybacks reducing equity from $12.72B in 2020 to $8.704B in 2024.
The company’s growth is anchored in its recurring revenue model (~70–75% of revenue from software licenses, support, and cloud subscriptions) and its aggressive expansion into AI-driven cloud services, positioning it to compete with industry giants.
🌍 Global Exposure and Currency Tailwinds
Oracle’s 45–50% international revenue (Europe ~25%, Asia ~15–18%) provides a hedge against US-specific economic pressures. A weaker US dollar boosts reported revenues when converting foreign earnings:
In 2022–2023, a strong USD caused FX headwinds of $1.3B–$1.6B, reducing reported revenue.
In 2024, stabilizing currencies (EUR, JPY) neutralized these effects, enhancing margins.
Long-term contracts (often 5+ years) lock in pricing in local currencies, ensuring stable cash flows even in volatile FX environments.
This global diversification, combined with multi-year deals in healthcare, government, and defense, reduces Oracle’s exposure to trade tariffs and supports its resilience in economic uncertainty.
⚠️ Critical Challenges and Risks
Despite its financial strength, Oracle faces significant hurdles that could derail its trajectory if not addressed:
1. Heavy Leverage and Liquidity Constraints
Oracle’s balance sheet is heavily leveraged, with historical trends showing increasing debt:
Total Debt: Grew from $69.23B in 2020 to $86.869B in 2024, driven by acquisitions (e.g., Cerner) and cloud investments.
Debt-to-Equity Ratio: Improved from negative equity (-$2.14B in 2022) to 9.98x in 2024, but remains alarmingly high.
Net Debt/EBITDA: At 5.12x in 2024 (up from ~3.5x in 2020), Oracle’s leverage is above investment-grade comfort levels (3x).
Liquidity: A cash ratio of 0.34 and current ratio of 0.72 indicate limited ability to cover short-term obligations, with $10.661B in cash dwarfed by debt.
ROIC vs. WACC: Oracle’s ROIC of 8% is below its WACC of 9.2%, signaling value destruction if investments don’t yield higher returns.
2. Critical Dependence on NVIDIA GPUs
Oracle’s AI strategy hinges on NVIDIA H100 GPUs for its OCI Superclusters, used for training and running large language models (LLMs). Key details:
Strategic Partnership: Oracle collaborates with NVIDIA to deliver AI cloud services to sectors like banking (e.g., JPMorgan for risk modeling), healthcare (e.g., Mayo Clinic for diagnostics), and AI startups (e.g., Cohere, Mistral AI). These deals are multi-year but early-stage, with revenues (~$1B in 2024) not yet covering costs.
Cost Burden: NVIDIA GPU costs are estimated at $1–2B annually, contributing to Oracle’s $6.866B CapEx in 2024. Supply constraints and rising H100 prices (up ~20% since 2023) increase financial pressure.
Limited Alternatives:
AMD MI300 GPUs: Oracle is testing these, but they lag in performance for large-scale AI training.
Intel Gaudi2: Suitable for inference but not training, limiting scalability.
In-house Accelerators: Unlike Google (TPUs) or Meta, Oracle lacks proprietary AI hardware, locking it into NVIDIA dependency.
Risk: If NVIDIA raises prices further or supply tightens, Oracle’s margins could shrink, especially since cloud pricing is locked in long-term contracts.
3. Premium Valuation
P/E Ratio: At 48.11x, Oracle trades at a significant premium to the S&P 500 (~25x).
P/B Ratio: 56.34x reflects a disconnect from its book value ($3.16/share).
P/FCF Ratio: 15x+ suggests the stock is not cheap, limiting upside unless AI/cloud growth accelerates.
📊 Competitive Landscape: Oracle vs. AWS, Azure, Google Cloud
Oracle’s OCI competes with AWS, Microsoft Azure, and Google Cloud, but trails in market share and AI maturity. A comparative analysis highlights Oracle’s position:
Metric
Cloud Revenue (2024)
YoY Growth
Market Share
AI Capabilities
Operating Margin
Strength
Weakness
Oracle’s Edge: OCI’s 50% YoY growth outpaces competitors, driven by enterprise deals in regulated industries (e.g., healthcare, government). Its hybrid cloud solutions appeal to clients needing on-premises integration.
Gaps: Oracle’s 2–3% market share lags far behind AWS (31%) and Azure (20%). Its AI offerings rely heavily on NVIDIA, unlike AWS (in-house chips) or Google (TPUs). Azure’s OpenAI partnership gives it a lead in generative AI.
Google Cloud Comparison: Like Oracle, Google Cloud is a late mover but benefits from proprietary TPUs and stronger AI R&D. Oracle’s higher margins (29% vs. 17%) give it a financial edge, but Google’s innovation pace is faster.
Oracle must scale its AI services and diversify GPU sources to close the gap with these giants.
📉 Historical Resilience and Recession Risks
Oracle’s recurring revenue model has historically cushioned it during downturns:
2008–2009 Recession: Revenues dipped slightly (~2%), but profits held steady due to software support contracts.
COVID-19 (2020): Revenues grew to $39.07B, and Oracle accelerated cloud investments, unlike competitors who cut back.
2022–2023 Inflation: Despite FX headwinds, Oracle increased CapEx to $8B+, doubling down on data centers.
However, its current high leverage and CapEx intensity make it more vulnerable in a recession:
Reduced enterprise IT spending could slow new cloud deals.
High debt servicing costs ($86.9B) could strain liquidity if FCF drops below $5B.
NVIDIA costs and locked-in cloud pricing could squeeze margins if demand falters.
📊 Future Outlook: Earnings Drivers and Catalysts
Oracle’s 19.76% earnings growth in 2024 is driven by:
Cloud and AI Expansion: OCI’s ~50% YoY growth and $60B+ in contracted revenue (multi-year deals) ensure stable cash flows.
Global Diversification: International revenue and a weaker USD could boost margins by 2–3% by 2027.
AI Scale-Up: If AI revenues reach $5B+ by 2026 (from $1B in 2024), margins could expand significantly.
Catalysts:
Enterprise AI Deals: Scaling partnerships (e.g., JPMorgan, Mayo Clinic) could drive revenue.
Debt Refinancing: Lower interest rates could reduce debt costs, freeing up FCF.
Buybacks/Dividends: Continued shareholder returns support stock stability.
Risks:
NVIDIA Dependency: Rising GPU costs or supply issues could erode margins.
Recession Pressure: A deep downturn could test Oracle’s liquidity, despite its recurring revenue buffer.
Competition: AWS, Azure, and Google Cloud’s scale and innovation threaten Oracle’s market share.
🛠️ Strategic Recommendations
Buy-the-Dip: Purchase below $140/share (fair value $140–$200) for a margin of safety.
Monitor NVIDIA: Track Oracle’s GPU diversification efforts and AI deal closures to assess cost coverage.
Interest Rates: A decline in rates could ease debt pressure; rising rates would exacerbate risks.
Long-Term Play: Oracle’s AI and cloud pivot requires patience, with significant returns likely post-2026.
📌 Conclusion
Oracle is a financial powerhouse with strong growth, robust FCF, and a strategic focus on AI and cloud. Its global exposure and long-term contracts provide stability, but high debt, premium valuation, and NVIDIA dependency pose risks. In a recession, Oracle’s resilience will be tested, but its recurring revenue offers a buffer. For long-term, risk-tolerant investors, Oracle is a compelling opportunity, especially at a discount.

Oracle Triangle Breakout: Targeting $182+"🔥"
📝 Caption/Description:
✅ Long Trade Setup on ORCL (30-min Chart)
🔹 Entry: $177.58
🔹 Stop Loss: $175.97
🔹 Target: $182.14
🔹 R:R Ratio: ~1:2.8
🔸 Symmetrical triangle breakout following strong uptrend
🔸 Immediate resistance: $179.80 — watch for breakout continuation
📊 Strategy: Pattern Breakout + Momentum Play
🦅 Chart by ProfittoPath

Oracle’s Chart Shows Bullish Signs Ahead of EarningsSoftware giant Oracle NYSE:ORCL , the hyper-scaling competitor in the artificial-intelligence race, plans to report fiscal Q4 numbers next Wednesday (June 11) after the bell. Let’s check out what it’s chart and fundamentals show heading into earnings.
Oracle’s Fundamental Analysis
You know how to tell that earnings season is just about complete? Just wait for ORCL to report, as it’s usually among the last of the Big Tech names to release numbers.
For the three months ended in May, Wall Street is looking for Oracle to report $1.64 of adjusted earnings per share on $15.58 billion of revenue.
If realized, those numbers would translate into 9% year-over-year revenue growth from the same period last year, along with a 0.6% improvement over the year-ago quarter’s $1.63 in adjusted EPS.
That said, all of the 24 sell-side analysts I could find that cover Oracle have revised their earnings estimates for the quarter downward since the period began.
But beyond the headline numbers, some investors might be watching for Oracle’s cloud revenues and cloud-infrastructure sales even more closely.
After all, while Oracle’s total revenues rose just 6.4% year over year in Q3, total cloud revenues grew 23%. Meanwhile, cloud-infrastructure sales gained a whopping 49% during Q3.
Oracle’s Technical Analysis
Now let’s look at ORCL’s chart:
Readers will see that Oracle is still in the final stages of completing a so-called “inverse head-and-shoulders pattern” that stretched from late February to the present, as marked with the purple curved lines above.
This pattern has a so-called “pivot” or “neckline” that runs through the $163 level vs. the $173.87 ORCL’s was trading at midday Friday.
Traders more often than not see an inverse head-and-shoulders pattern as bullish, and that's not all that appears technically positive for Oracle in the above chart.
The stock’s Relative Strength Index (the gray line at the chart’s top) has just started to scratch what can be seen as technically overbought territory, but Oracle has retaken its 200-day Simple Moving Average (or “SMA,” marked with a red line above).
This happened in just the past few days, after the stock hit some resistance at the 200-day line.
The 200-day SMA is key here because it’s the one moving average above all others that typically forces portfolio managers to increase or decrease long-side exposure -- often under pressure from their risk managers.
Meanwhile, Oracle’s retake of the 200-day SMA also came after a mid-May crossover by the stock's 21-day Exponential Moving Average (or “EMA,” marked with a green line) over ORCL’s 50-day SMA (the blue line above).
That’s traditionally a bullish sign that technicians refer to as either a “mini golden cross” or “swing traders' golden cross.”
There's even more technical positivity in the above chart if you look at the stock's daily Moving Average Convergence Divergence indicator (or “MACD,” marked with black and gold lines and blue bars above).
The histogram of the stock's 9-day EMA (the blue bars) is above zero, while the 12-day EMA (the black line) runs above the 26-day EMA (the gold line) -- with both in positive territory.
Traders historically see this combination of conditions in the MACD as bullish.
(Moomoo Technologies Inc. Markets Commentator Stephen “Sarge” Guilfoyle had no position in ORCL at the time of writing this column.)
This article discusses technical analysis, other approaches, including fundamental analysis, may offer very different views. The examples provided are for illustrative purposes only and are not intended to be reflective of the results you can expect to achieve. Specific security charts used are for illustrative purposes only and are not a recommendation, offer to sell, or a solicitation of an offer to buy any security. Past investment performance does not indicate or guarantee future success. Returns will vary, and all investments carry risks, including loss of principal. This content is also not a research report and is not intended to serve as the basis for any investment decision. The information contained in this article does not purport to be a complete description of the securities, markets, or developments referred to in this material. Moomoo and its affiliates make no representation or warranty as to the article's adequacy, completeness, accuracy or timeliness for any particular purpose of the above content. Furthermore, there is no guarantee that any statements, estimates, price targets, opinions or forecasts provided herein will prove to be correct.
Moomoo is a financial information and trading app offered by Moomoo Technologies Inc. In the U.S., investment products and services on Moomoo are offered by Moomoo Financial Inc., Member FINRA/SIPC.
TradingView is an independent third party not affiliated with Moomoo Financial Inc., Moomoo Technologies Inc., or its affiliates. Moomoo Financial Inc. and its affiliates do not endorse, represent or warrant the completeness and accuracy of the data and information available on the TradingView platform and are not responsible for any services provided by the third-party platform.
