Occidental Petroleum Corp. ($OXY) LongLook for a bounce on $OXY off support to regain 50dma and test 66. OXY 3/31 62C for $2 looks pretty good for a swing.
1OXY trade ideas
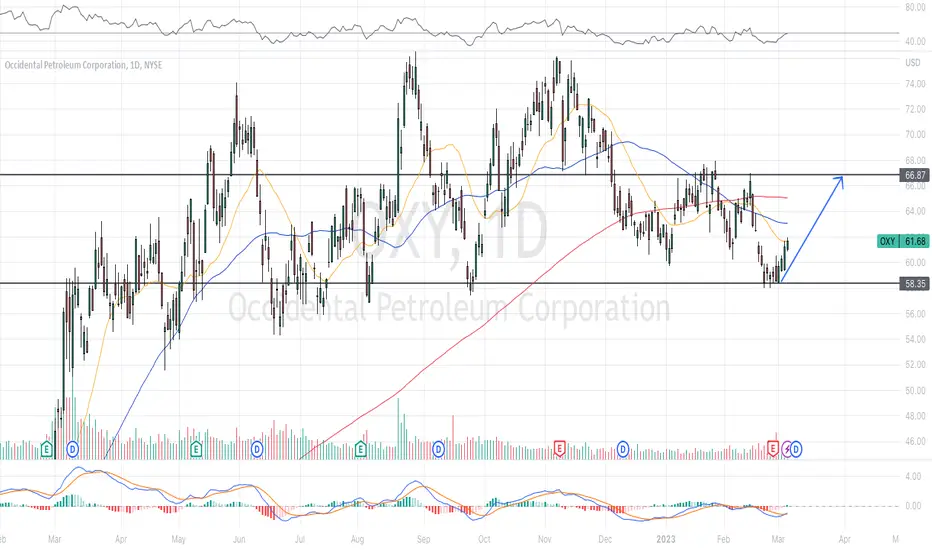
$OXY Looks interesting..I can definitely appreciate the balance zone it created over the last 7 days or so..now price is looking for acceptance over $59, doing so can really get this going..

OXY ready for take off!!!Oxy ready for take off!!! Consolidating and ready to bounce. I believe a big move to previous highs.

OXY Oops... Previously, posted about the head and shoulders (potential) breakdown of OXY, based on the technicals. Thereafter, there was a weak attempt to recover above the 23EMA, and it faked out. Yes, for a couple of weeks, it did look like a wrong analysis, wrong call, etc. BUT the point is not about being right nor wrong, but being able to read and read it well. For this case, a bearish pattern failure is not a bullish sign. I think we need to establish this as a baseline in our psychology. A bearish pattern failure (seemingly so), in this case was an extension or delay only to show the true colours/commitment. Here, we can see that the bulls failed miserably. A failed weekly breakout, a gap down and break down of the 23EMA, a failed attempt to recover bullish grough above the 23EMA, another 23EMA failure and followed by a recent weekly low close; all with the indicators already pointing to bearishness or at least weakness since the start of 2023.
The yellow dotted vertical line is the confirmation point IMHO.
Target downside, if this continues is between 40-45, where we can look forward to some consolidation and recovery pattern(s).
Notwithstanding, a major war escalation and the likes might trigger an immediate reversal. But that's another story...
For the record, I am actually keen to accumulate OXY, but not now clearly. Not shorting it too as it is counter my initial objective of monitoring this.

$OXY $XLE Oracle of Omaha favorite setting up for a gap fill $OXY $XLE Oracle of Omaha favorite setting up for a gap fill. Thing energy has potential for upside if recession fears continue to diminish, also hedge for war escalations.

Brent oil prices fell during early Wednesday trading OIL
Brent oil prices fell during early Wednesday trading. Expectations within the financial markets have been shifting to accommodate the resilience of the US economy and stubbornly sticky inflation, resulting in an outlook that now assumes the Federal Reserve will hike rates further than previously thought. This scenario, of a hawkish Fed causing a hard landing for the economy, dents the growth prospects of the US and to some extent those of the rest of the world. The latest FOMC minutes are due for publication later today, when fears of a hawkish tilt could be confirmed, exacerbating the downgrading of growth expectations – a scenario that could see oil prices suffer further as the markets price-in lower future demand.
Ricardo Evangelista – Senior Analyst, ActivTrades
ACTIVTRADES:BRENTAPR23

Buying at the bottom of the range OXY, warren's darling has formed a bullish harami/dragonfly doji and is rebounding at the key demand zone. Hence, I would be heading for a buy at different levels. First target resistance will be at 66.33

OXY - Great setup
NYSE:OXY - Elliott wave Analysis
Warren Buffet bought OXY in Q1,Q2 and Q3 of 2022. We can't all be Buffets but a a good setup might be in place right now.
A clear upward impulse wave starting in October 2020, with an extended third wave that reached its peak on May 31, 2022.
Since then, we have been witnessing a period of consolidation in the form of a retracement wave (4). The sideways movement of the price is characteristic of a triangle pattern.
Triangles are a slow and sideways movement that indicate a balance in the convictions between bulls and bears. They are only present in waves 4, B, and X, preceding the final wave of a sequence.
The eventual outcome of a triangle pattern is a wave 5 of the impulse sequence, also know as the post triangle thrust. The good part is that we can calculate this post triangle thrust.
In terms of Fibonacci retracements, the current retracement of 0.236 in wave 3 aligns with the second most common Fib retracement for wave 4.
It is important to note that triangle patterns can be difficult to trade. Why because in this case the triangle can take the form of a B wave at a larger degree than fall in wave C finishing the correction. than moving up in wave 5 of the larger impulse wave. This may not be relevant in the current situation, however, it is important to exercise caution and keep this in mind."
When they conclude though, they result is the post triangle thrust.
ConclusionGood upside potential at least to $74 level 13% increase from the current level. There is also another energy stock with the same wave count NYSE:PXD this time with a dividend yield of 11 %.
Legal Disclaimer: The information presented in this analysis is solely for informational purposes and does not serve as financial advice.

put credit spread price boucning off support
expire right before earnings
going for credit spread as risk of non volatile period to earnings
- reminder to self
- check volume, spread and open interest of options
- check major news event
- check support and resist lvl and its reaction

‘Death Cross’ in OccidentalOil and gas producers like Occidental Petroleum began 2022 with a bang, but this year has been just the opposite. (TradeStation data shows energy is the only major sector to fall in the last three months as crude languishes.)
The first pattern on today’s chart of OXY is the 50-day simple moving average (SMA) slipping beneath the 200-day SMA on Friday. That “death cross” can suggest the longer-term trend is turning bearish. It also sticks out like a sore thumb considering that the bigger S&P 500 had a “golden cross” just one session earlier.
Second, the series of lower highs since August may suggest buyers are getting tired.
Third, prices closed Friday below a rising trend line along its recent lows.
Finally, the short-term trend could also be bearish: Notice how the 8-day exponential moving average (EMA) is back under the 21-day EMA. (This chart includes our 2 MA Ratio custom script.)
TradeStation has, for decades, advanced the trading industry, providing access to stocks, options, futures and cryptocurrencies. See our Overview for more.
Important Information
TradeStation Securities, Inc., TradeStation Crypto, Inc., and TradeStation Technologies, Inc. are each wholly owned subsidiaries of TradeStation Group, Inc., all operating, and providing products and services, under the TradeStation brand and trademark. TradeStation Crypto, Inc. offers to self-directed investors and traders cryptocurrency brokerage services. It is neither licensed with the SEC or the CFTC nor is it a Member of NFA. When applying for, or purchasing, accounts, subscriptions, products, and services, it is important that you know which company you will be dealing with. Please click here for further important information explaining what this means.
This content is for informational and educational purposes only. This is not a recommendation regarding any investment or investment strategy. Any opinions expressed herein are those of the author and do not represent the views or opinions of TradeStation or any of its affiliates.
Investing involves risks. Past performance, whether actual or indicated by historical tests of strategies, is no guarantee of future performance or success. There is a possibility that you may sustain a loss equal to or greater than your entire investment regardless of which asset class you trade (equities, options, futures, or digital assets); therefore, you should not invest or risk money that you cannot afford to lose. Before trading any asset class, first read the relevant risk disclosure statements on the Important Documents page, found here: www.tradestation.com .

$OXY about to Death Cross for the 1st time since 11/2018 $OXY about to Death Cross for the 1st time since 11/2018 and approaching the bottom of uptrend that's been holding since 3/2022
Calls over $64.02, $65.96
Target $64.54
Puts under $61
Target $60.75, $59.73

Running Low on OXY?Running Low On OXY?
I believe we will be "running low on oxy" over the next few days or weeks.
A head and shoulders pattern was identified on the daily in confluence with 2 rising support trendlines. OXY broke below the neckline of the head and shoulders pattern on Friday, February 3, 2023. Furthermore, the daily chart shows an increase of sellers at the break of the neckline.
Therefore, I'd be interested in shorting OXY if it holds below the neckline AND breaks below the 2 rising support lines (for further confirmation). The level of interest is 60.
Akili,
MrALtrades00
*This is not financial advice.


Oxy - clear signals for continuation Oxy respecting long term trend line, over the point of control, with thin volume nodes above, TTM squeeze fired long on the daily time frame, which averages 8-10 bars. These combined bullish signals indicate very little resistance in the near term. Chart shows a glide path to $69, with an overall technical price target of $80

$OXY Trade Idea - Bullish Engulfing and close above 50EMA on day$OXY Trade Idea
Bullish Engulfing and close above 50EMA on daily
Calls over $66.02
Targets: $67.05, $70.25
$Puts under $63.78
Targets: $62.94, $62.22, $60.75
NYSE:OXY

OXYPredictive charting -- would be fun to see this play out ,, sell off into summer .. summer rally into EOY.

Oil ready to run?Looks like $OXY is in the mix of a bullish divergence. So lets dig. Look at the lower low on the price it is sharp. It needs to rest the oscillator. Here is the thing, if we can hold above the 0 line on the MACD and start to open up we can see the ticker really run.
Bull Case we have a divergence forcing the gap up. I am looking that if there is a gap fill to take it back to the top with the ema as support. We will see what the market have. for continuation it need to blow pass $65. One of those are the entry.
Bear case first time above the ema since November with 2 candle open and close. This gap fill will be the beginning of the run back down. We are below the 0 line, there is nothing here to see but read. Break below $62 new lows will follow.

OXY An old story with H&S breakdownOops. GG…
Broken down of the support and Head & Shoulder formation.
Technical indicators are aligned for more downside too.
Wait for the week to finish the candle… I do not see much upside at this point.

OXYKeep an eye on this one. Noted the bearish RSI divergence a few months back. Could potentially be forming a triple top here.

OXY Bears coming?Occidental Petroleum Corporation looks like it wants to fill the Fair Value Gap below current PA.
2 scenarios:
A: Price disrespects Bullish OB and drops, or
B: Price respects Bullish OB and push higher into Fair Value Gap (~65$) and drops from there.
There's a lot of targets below the current PA, but lets focus at the first one: 50$ ~ -20% from Today's price.
Wait for confirmation, no entry without LTF Confirmation :).


OXY: Long-term VIEWHello my friends, today I wanna share you some conclusions that I found about OXY.
At the moment OXY price trades near to the raising wedge bottom.
Though USOIL currently bounced up but I think there's a counter-trend decline to OXY.
I expect that price can break the wedge and make a little correction to the bottom of wedge and then start to fall.
And I think OXY will bounce from the bottom of wedge and get support at previous high level.
I set up my first target at previous high and support level $47.00.
Then, I think price will bounce up and start to raise.
And I think price will break resistance level and go higher until resistance level.
Therefore I set up my second target at local high and resistance level $77.54 (red line).
And, I think price will break resistance go higher.
Here's the scenario that I expect to USOIL.
This is my opinion, I really hope it will be useful for you.
This is an article not financial advice, always do your own research.
And please don't forget to support this idea with your like and comment, It means a lot to me, thanks.
Be prepared and save your money. Make big profits!
Happy trading!

Occidental petroleum updateOccidental petroleum is long for high targets , it’s in last minutes of correction and ready for jump
