$OXY with a Neutral outlook following its earnings #Stocks The PEAD projected a Neutral outlook for $OXY after a Negative Under reaction following its earnings release placing the stock in drift D with an expected accuracy of 33.33%.
1OXY trade ideas

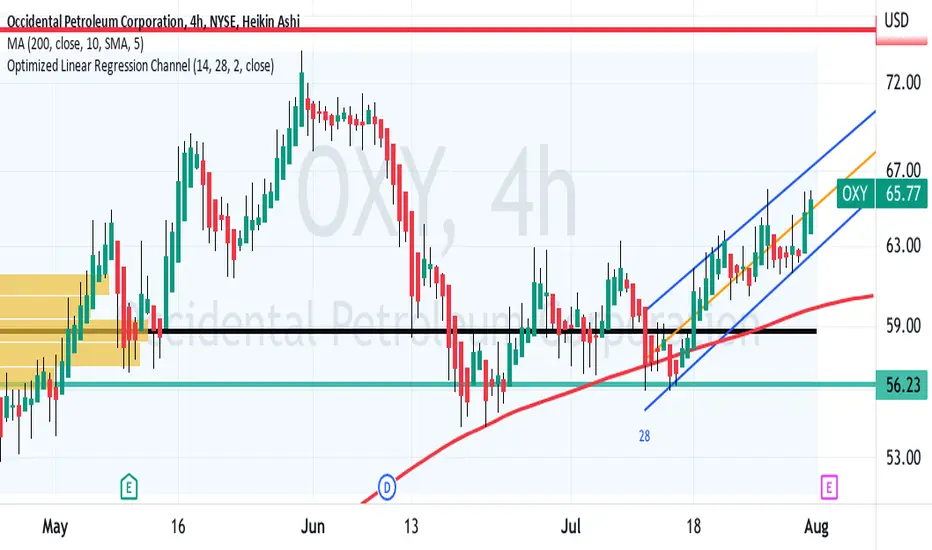
Long on OXY ?!Watching this potential bounce from LOW on OXY, the sector looks oversold, and gas prices continue to rise.
Breaking trendline, Support Levels bounce! (Short Term) Trend changes from a bearish to a bullish!
Target at $65.70 , $67.79
Stoploss at $60
RR is 2.89 ! So I would take the risk at any time!

What Does This Say About the Future?As many of you know, this week Warren Buffet increased his stake in the oil and natural gas company Occidental Petroleum Corp. (OXY).
Warren Buffett’s holding company Berkshire Hathaway now owns about 21% of the company.
In light of Warren Buffet's purchase, I analyzed the chart of OXY to see what he or his analysts might be seeing. As I'll explain below, what I found was concerning for multiple reasons.
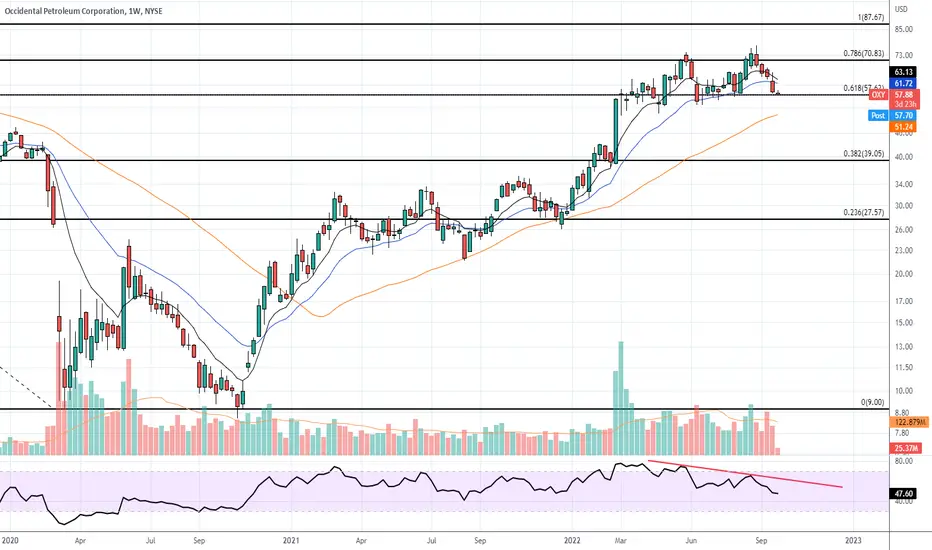
This is the yearly chart of the entire price history of OXY. Each candle represents the price action for one year.
It is important to log-adjust your charts in general, but especially when analyzing higher timeframes. Below is a log-adjusted chart.
Since OXY is also a dividend-paying stock, analyzing its history over such a long time period over which it has paid dividends means we need to adjust for dividends as well. Below is a dividend-adjusted chart.
Now that the chart has been properly adjusted, we can do our chart analysis.
Looking at this chart, I immediately noticed that OXY is about to undergo a major Fibonacci extension. I will explain more below.
First, I applied Fibonacci levels from the lowest low to the highest high.
You can see my Fibonacci levels applied in the chart above (I hid the 0.5 level because that is actually not a Fibonacci level).
I noticed that, during the COVID-19 Pandemic, OXY's price bounced off of the golden ratio and then proceed to move much higher. See the below chart.
In my experience, this type of price action is rare and usually proceeds what is called an "S-curve jump". Without getting too deep into higher-level mathematics behind S curves, in short, an S-curve jump basically means a major breakout may occur on the time frame in which it appears. Following an S-curve jump, prices can move much higher. Since this particular jump is occurring on a high timeframe, be mindful that the move can seem slow, and there can even be periods of weeks or months of declines even though a breakout on the yearly timeframe is underway. Perhaps this is why Warren Buffet accumulated so many shares of this company. Warren Buffet is long-term investor and so investing based on the yearly chart is most consistent with a multi-decadal investment strategy like his.
To help you visualize what an S-curve jump looks like I've illustrated it below. This chart is purely illustrative and is not my actual price projection for OXY (it's impossible to accurately predict price so far into the future).
As shown above, price jumps from one S-curve to another, leading to significant increases in price.
Interestingly, the second S-curve often starts at the golden ratio retracement of the previous S-curve.
Once the price successfully jumps an S-curve, the price increases can be monumental. Actually, it is during the period after price jumps an S-curve that most people get wealthy from their investment. It's how 'millionaires are created'. However, price tends to falter at each successive Fibonacci extension. Below I've highlighted an example of this using Bitcoin which moves almost entirely based on Fibonacci extensions and retracements.
Notice how following a perfect golden ratio retracement, Bitcoin moved up to nearly the next Fibonacci extension level before collapsing back down a Fibonacci level. You can see clearly that price has been hovering right on a Fibonacci level in recent months.
Going back to OXY, we can use a regression channel to try to validate the hypothesis that price may move much higher in the coming year(s). See the chart below.
A regression channel merely measures how far above or below its mean an asset is currently priced. Each blue line represents a standard deviation from the mean. We can see that OXY's price recently reached its mean (the red line) before retracing back down. Similar to retracement after reaching Fibonacci extensions, it is common for price to retrace some of its move each time it hits a higher standard deviation.
What's noteworthy is that although OXY's price has come all the way back up near its all-time high, the regression channel shows that this level is now merely the price's mean. See the below chart.
This suggests that, from a mean regression perspective, OXY's price can rise much higher before becoming as overextended as it was the last time it was priced at this level.
If we conclude that OXY's price is poised to go much higher, what does this say about the future? What might spiraling energy prices say about the Federal Reserve's, and other central banks', ability to fight inflation? By buying OXY while the Fed is trying to fight inflation, is Warren Buffet fighting the Fed? What might higher energy prices say about supply issues in the long term? Might higher energy prices reflect a prolonged period of deglobalization, or perhaps, something worse like geopolitical conflict? What might the consequences of higher energy prices be for climate change? Will higher energy prices incentive more investment in alternative energy options like solar, wind, nuclear and hydrogen?
One thing is for certain: The scope of monetary easing that we saw over the past couple of decades is unprecedented in history, and it has created an asset bubble that is unfathomable. I will leave you with two additional charts. One shows how low U.S. GDP growth has been over the past couple of decades, and yet how high its stock market has climbed due to monetary easing.
How do you soft land a stock market that's risen into the stratosphere? By pushing it gently to the surface of the moon.

OXY shortShorting OXY as:
- Hit liquidation zone
- Hit the opening gap down
- Shows a high RR for the trend ton 'fade'

$OXYDefinitely in phase 3 - distribution. Could create a triple top but I'd be careful with energies after this rally. I'm going to short below the volume shelf and below 50 MA (red). Today we might have a bounce.

OXYLot of hype around this name the last few weeks/couple months with Uncle Warren buying up the company. No serious technical damage done yet, but a double top is potentially forming. Bearish RSI divergence noted. I'm cautious below $57, bearish below $54.
OXY AND HURRICANESIt is time to put Oil on your radar for two reasons. One thing that is really striking is how the stores are already selling completely out of water this weekend, after visiting 8 stores and coming up empty handed. BUT, how will the country be faced with gasoline shortages as mass panic begins to strike into the human mindsets, fear, and much more. Especially with not knowing the exact placement of the hurricane and the strength of destruction as the country is facing record high inflation and the government is depleting the strategic reserves of our Oil. THEY will need to start buying the Oil off the market at a rapid pace before the price of oil begins to aggressively increase - thus fueling the demand for buying; causing a momentum spike in price action.
I am linking my home repair and oil charts below for simplicity purposes.
My support/resistance lines are represented with the horizontal lines. You can use those as targets and/or entries for positions based on bounces of those areas or rejections.

OXY Buy the Dip LONGOn the 4H OXY is in a long up trend in part supported by the buy of Mr. Buffett
In the intermediate term as shown on the chart, it is in a slowly rising parallel channel
while at present it is at the bottom of the channel sitting on the POC of the long term
volume profile and near to the lower Bollinger Band. I see this as a buy low sell high
opportunity, The is confirmed with the MACD a lagging indicator with the lines below
the histogram and not yet crossing over. Spot oil may be at a pivot point and
OXY is setting up long.

Natural Gas In Trouble (Part 3/3)Many participants rushed into OXY because of Warren Buffett, and the Buffett-related spike on 19 August now looks like a trap to lure in latecomers into the oil&gas space. Any breakdown from a mini flag pattern could lead to a swift move to key $57 neckline.

QuickTrade n. 50 : OXYLong : Looking for a bullish cross of the 21h on both the 50h and 250h
Short, looking for a rejection of the 21h on the 50h

Occidental Petroleum: Is it Time to Go Back to the Well?Occidental Petroleum is the biggest gainer in the S&P 500 this year, but was the biggest decliner last week. Is the dip an opportunity for the bulls?
The first pattern on today’s chart is the surge to a new 52-week high in late August. It is one of only 12 S&P 500 members to hit a new high in the last two weeks (and the only energy company.) That relative strength may reflect interest by large investors.
Second, the dip since then has bought OXY back to its 50-day simple moving average (SMA). Notice how that line was support in the spring and resistance over the summer. Can it bounce there again?
The stock is also back to the $64 area where it peaked in July and paused before breaking out in August. Some traders could now view that price zone as potential support.
Next, you have an outside day on Thursday and an inside day (with a hammer) on Friday. That may suggest OXY is attempting to stabilize.
Fourth, the succession of higher lows in June, July and August could suggest its longer-term uptrend remains in effect.
Finally, stochastics have dipped to an oversold condition.
TradeStation has, for decades, advanced the trading industry, providing access to stocks, options, futures and cryptocurrencies. See our Overview for more.
Important Information
TradeStation Securities, Inc., TradeStation Crypto, Inc., and TradeStation Technologies, Inc. are each wholly owned subsidiaries of TradeStation Group, Inc., all operating, and providing products and services, under the TradeStation brand and trademark. You Can Trade, Inc. is also a wholly owned subsidiary of TradeStation Group, Inc., operating under its own brand and trademarks. TradeStation Crypto, Inc. offers to self-directed investors and traders cryptocurrency brokerage services. It is neither licensed with the SEC or the CFTC nor is it a Member of NFA. When applying for, or purchasing, accounts, subscriptions, products, and services, it is important that you know which company you will be dealing with. Please click here for further important information explaining what this means.
This content is for informational and educational purposes only. This is not a recommendation regarding any investment or investment strategy. Any opinions expressed herein are those of the author and do not represent the views or opinions of TradeStation or any of its affiliates.
Investing involves risks. Past performance, whether actual or indicated by historical tests of strategies, is no guarantee of future performance or success. There is a possibility that you may sustain a loss equal to or greater than your entire investment regardless of which asset class you trade (equities, options, futures, or digital assets); therefore, you should not invest or risk money that you cannot afford to lose. Before trading any asset class, first read the relevant risk disclosure statements on the Important Documents page, found here: www.tradestation.com .

Warren Buffett Given Regulatory OK To Buy 50%Warren Buffett has been steadily buying this stock over the last few months and now owns 26.8%
With regulatory approval now allowing him to own up to 50% will be interesting to see where this stock ends up.
Indicators look good. Price at a support area, RSI showing good value, and MACD looks like momentum might be coming back into the stock after its recent pullback.
One way to buy this kind of stock could be with a stop or a stop limit order so if it does wiggle up on open then you enter the trade. If it does break through resistance and head downwards then your order wont trigger and you wont be in the trade.
Could be worth keeping an eye on and adding it to your watchlist to do more research.

Gentleman's OXY?Got FOMO'ed in b/c WEB kept buying? Take measure to protect yourself from a potential drop in the short term:
It started with negative divergence in March, noticing that volume did not follow through after the breakout, it might end up with a H&S formation that project to the low 40's (blue lines).
That region happens to coincide with:
- the yellow trendline with multiple tops in the past, which can now function as support;
- an interesting retracement level;
- a volume profile wedge.
This is a short term set up based on technical, invalidation above 70.
With the intention to (partially) take over, it makes sens for a whale to keep buying regardless whether price goes up or down.
Assess your own situation as it might differ.

OXY SHORT after bouncing down from All Time ResistanceOXY as shown on the chart is still in a megaphone pattern.
Horizontal resistance red line is the all time highs of Spring 2018.
In the past several trading sessions, spot oil has dropped from $96 to $87.
The MACD indicator which is lagging shows the K / D cross over the histogram.
Accordingly, OXY is now trending downward to the mid-Fibonacci retracement levels
and the confluence of the mid-line of the megaphone pattern.
This appears to be a safe short trade setup especially now that the buying
pressure of Mr. Buffet has subsided.

Is OXY topping at resistance ? ( Possible Reversal )OXY has run up quite well, especially with the help of heavy buying from Warren Buffet and his conglomerate.
Is it set up for a downturn?
On the chart, the red horizontal line is the market high pre-Covid.
The MACD a lagging indicator has the K and D lines in early convergence
well above the histogram.
Time will tell but OXY might be pulling back into a better price for buying.

OXY strong buyEntry price: 74.1
Target price 1: 80.1 +8%
Target price 2: -
Stop-loss: 70.85 -4.4%
Period length: 3-5 days

OXY Going to $80+ by end of AugustI have been watching OXY the past two weeks and I have strong evidence that the stock will rally to monthly highs. My personal contract target is $85 September 9 Calls.
Give this one more time, it has been consolidating the last week after Buffet's news but I think we have more buying to come. Notice how even when the market dropped 1,000 points last Friday, OXY was still holding strong above 50% ownership rumor levels ($75+).
Personal Target - $88.00+ by end of September.
Not to be deemed as financial advice.

OXY - LonggRecent News
Warren Buffett’s Berkshire Hathaway on Friday received regulatory approval to purchase up to 50% of oil giant Occidental Petroleum. This caused the massive candlestick on 19th Aug.
Fundamental
Profitability:
OXY's Return On Assets of 14.82% is among the best in the industry. OXY does better than the industry average Return On Assets of 5.23%.
OXY's Return On Equity of 39.51% is among the best in the industry. OXY does better than the industry average Return On Equity of 24.13%.
OXY has a Profit Margin of 32.48%. This is better than the industry average of 16.24%
Valuation:
Price/Earnings Ratio: 9.64
Forward Price/Earnings Ratio: 9.17
Growth:
Earnings Per Share - In the last year, the EPS has been growing by 626.21%.
Earnings Per Share - Measured over the past 5 years, EPS has been growing by 29.36% on average per year.
Revenue - Measured over the last 5 years, Revenue has been growing by 20.70% yearly.

Impending Breakou (WEEKLY)OXY has been on fire this year and its looking to go higher. On the weekly OXY is looking to breakout of its previous high set at 73 in May. MACD is curling up and RSI is looking to go upwards as well. Very bullish closes over the past two weeks. Looking for it to hold above 75 this week before I enter.

OXY Sellers Fall Down ( Flat Bottom Triangle Breakout) LONGNYSE:OXY
One hour chart: NYSE:OXY
In the past day, the relative volume of sellers has decreased
and price momentum is gradually increasing despite
the general market reaction to federal economic news.
The flat bottom triangle breakout suggests sellers are capitulating
on pricing given current circumstances. The RSI Oscillator
is in a mid-range suggesting more upside.
I see a long setup with call otpions 2 weeks expiration strike $85.

Occidental USA SSI Live Trading Series
Sun Storm Investment Trading Desk & NexGen Wealth Management Service Present's
Focus: Worldwide
By Sun Storm Investment Research & NexGen Wealth Management Service
A Profit & Solutions Strategy & Research
Trading | Investment | Stocks | ETF | Mutual Funds | Crypto | Bonds | Options | Dividend | Futures |
USA | Canada | UK | Germany | France | Italy | Rest of Europe | Mexico | India
Disclaimer: Sun Storm Investment and NexGen are not registered financial advisors, so please do your own research before trading & investing anything. This is information is for only research purposes not for actual trading & investing decision.
#debadipb #profitsolutions

8/24/22 OXYOccidental Petroleum Corporation (NYSE:OXY)
Sector: Energy Minerals (Oil & Gas Production)
Market Capitalization: 69.778B
Current Price: $74.91
Breakout price: $75.60
Buy Zone (Top/Bottom Range): $71.55-$65.95
Price Target: $85.50-$86.60
Estimated Duration to Target: 30-33d
Contract of Interest: $OXY 10/21/22 85c
Trade price as of publish date: $2.87/contract

OXY in an ascending channeland heading towards all time high ( 2019) resistance
having crossed through the high volume area
and over the SMA 100 in the past ten trading
days with earnings impending. They will be
excellent. Warren Buffet seldomly buys junk.