$PYPL should be in your kids kids accountNASDAQ:PYPL breaking out! PayPal forming solid base above $70 after 3-month consolidation. Recent upgrade from Seaport Global signals shifting sentiment. Chart shows golden cross with volume confirmation.
Key resistance at $75 once broken, path to $85+ looks clear.
Long-term target: $141 .
Ultimate goal: reclaim ATH of $275.51! Digital payments growth story intact! #PayPal #Fintech #BullishBreakout
1PYPL trade ideas
PayPal: Short Position Recommended as Bearish Divergence SignalsCurrent Price: $71.36
Direction: SHORT
Targets:
- T1 = $69.00
- T2 = $66.50
Stop Levels:
- S1 = $73.00
- S2 = $74.50
**Wisdom of Professional Traders:**
This analysis synthesizes insights from thousands of professional traders and market experts, leveraging collective intelligence to identify high-probability trade setups. The wisdom of crowds principle suggests that aggregated market perspectives from experienced professionals often outperform individual forecasts, reducing cognitive biases and highlighting consensus opportunities in PayPal.
**Key Insights:**
PayPal is currently showing bearish divergence on its technical charts. This pattern signals potential downward pressure in the near term, as momentum indicators weaken in alignment with subdued price action. Increased competition from fintech rivals like Stripe and Shopify, coupled with slowing transaction volume due to macroeconomic headwinds, further exacerbates the bearish outlook. Regulatory scrutiny over Buy Now Pay Later (BNPL) services and cryptocurrency initiatives has also dampened investor sentiment, adding to immediate challenges.
**Recent Performance:**
The stock has consistently underperformed relative to the broader market indices in recent weeks. Recent price movements indicate a lack of momentum, as resistance levels hold firm and sellers dominate. The fintech sector as a whole has struggled to regain investor confidence amid rising interest rates and overall market uncertainty.
**Expert Analysis:**
While PayPal remains a long-term innovator in digital payments with a diverse ecosystem including Venmo and other strategic assets, analysts have shifted focus to short-term concerns. Sizable growth in competition from nimble startups and well-funded businesses is eroding PayPal's market share. Additionally, its earnings growth has plateaued in recent quarters, with slowing active user growth underpinning these challenges. The stock's valuation appears stretched given the competitive pressures and an uncertain macroeconomic backdrop.
**News Impact:**
Recent developments, such as PayPal's exploration into blockchain initiatives and partnerships with global payment platforms, highlight its forward-thinking strategy. However, the immediate market reaction has been muted due to concerns over execution risk and the pace of e-commerce growth normalization post-pandemic. Until breakthrough results emerge from these initiatives, the short-term outlook remains bearish.
**Trading Recommendation:**
Given the bearish divergence and weak price momentum, a short position is recommended for PayPal at the current price of $71.36. A target of $69.00 (T1) and a secondary target of $66.50 (T2) provide lucrative reward potential. For risk management, place stops at $73.00 (S1) and $74.50 (S2). Traders should remain vigilant for any macroeconomic developments or earnings updates that could alter sentiment.

$PYPL - The time has come!NASDAQ:PYPL - The time has come! 🚀
Undervalued and breaking out.
Measured Move is $94 before November 🎯

"PYPL Money Grab – Ride the Bull Wave Before the Reversal!"🔥 PAYPAL HEIST ALERT: Bullish Loot Grab Before the Trap! 🔥 (Thief Trading Tactics)
👋 Greetings, Market Bandits & Cash Pirates! 🏴☠️💰
This is not financial advice—just a strategic robbery blueprint for PayPal (PYPL).
🎯 THE MASTER PLAN (Day/Swing Heist)
🔑 Entry (Bullish Swipe):
*"The vault’s cracked—bullish loot is ripe! Enter at ANY PRICE or snipe pullbacks (15m/30m swing lows/highs)."*
🛑 Stop Loss (Escape Route):
Thief’s SL: Recent swing low candle body/wick (3H TF).
Your SL = Your Risk. Adjust for lot size & multiple orders.
📈 Target: 82.00 (or escape earlier if bears ambush!)
⚡ SCALPERS’ NOTE:
Longs ONLY. Hit quick profits? Run. Still hungry? Ride the swing heist!
Trailing SL = Your Getaway Car. 🚗💨
⚠️ DANGER ZONE (Yellow MA):
Overbought | Consolidation | Bear Trap | Trend Reversal Risk!
Take profits early—greed gets caught! 🏆💸
📡 FUNDAMENTAL BACKUP (DYOR!):
Check: COT Reports | Macro Trends | On-Chain Data | Sentiment Shifts 🔍🔗 (.Linnkkss. 👉 is there to read!)
🚨 NEWS ALERT (Volatility Warning!):
Avoid new trades during news.
Trailing SL = Survive the Chaos.
💥 BOOST THE HEIST!
👊 Smash "Like" & "Boost" to fuel our next robbery! More loot = More plans! 🚀
🔔 Stay tuned—next heist coming soon! 🤑🎉

PayPal: Bears Losing Control – AgainPayPal (PYPL) has faced renewed downside pressure since our last update, but the bears failed to maintain control for long. The stock quickly rebounded toward key resistance at $78.86. If this level is decisively breached, we will consider the broader correction complete with the alternative low of beige wave alt.II. This would position the stock in the early stages of a new bullish impulse – wave alt.1 – with a 45% probability assigned to this scenario. However, under our primary scenario, we still envision wave II reaching its regular low below support at $50.18. Thus, renewed selling pressure is expected to push the price beneath that level in the near term. Once the low is in place, we reckon with a new impulsive advance.
📈 Over 190 precise analyses, clear entry points, and defined Target Zones - that's what we do.

LONG (E-PAY)PAYPALHuge tail on this in larger frames, and another huge hmnc on daily. see flagging into gap...if info TL holds any weight ill find out. tossed coin at NASDAQ:PYPL $80 6-27-25 call @ 0.15; at that price...Why not.
PayPal poised for recovery as fintech sector evolves
Targets:
- T1 = $72.15
- T2 = $74.55
Stop Levels:
- S1 = $68.75
- S2 = $66.50
**Wisdom of Professional Traders:**
This analysis synthesizes insights from thousands of professional traders and market experts, leveraging collective intelligence to identify high-probability trade setups. The wisdom of crowds principle suggests that aggregated market perspectives from experienced professionals often outperform individual forecasts, reducing cognitive biases and highlighting consensus opportunities in PayPal.
**Key Insights:**
PayPal’s stock displays resilience amid broader fintech sector challenges, finding stable ground at its 50-day moving average—a key technical support level. Regulatory uncertainties surrounding stable coins and digital currencies present challenges but also potential opportunities for growth. The company’s robust technical positioning suggests room for upside, especially if the broader fintech sentiment improves.
PayPal’s leadership in the digital payment landscape and its push into cryptocurrency transactions, coupled with potential advancements in financial technology and partnerships, highlight its long-term potential. However, near-term volatility is expected given the tight regulatory landscape and macroeconomic pressures.
**Recent Performance:**
PayPal’s recent performance has mirrored broader market movements in the fintech sector. The stock has hovered around its key technical support levels, showing signs of stabilization. Despite bearish macro trends in digital finance, PayPal has displayed resilience, maintaining its position above critical price points.
**Expert Analysis:**
Market analysts are divided on PayPal, with some citing regulatory risks as significant headwinds and others emphasizing its technical setups and long-term growth opportunities. The stock’s ability to hold its ground even amid sector-wide challenges suggests that it has potential for recovery in the medium-to-long term. Professional traders view PayPal as a potential buy, particularly for those willing to ride out near-term instability for future upside gains.
**News Impact:**
Recent regulatory developments concerning stable coins and cryptocurrency transactions have undeniably influenced PayPal’s outlook. While regulatory pressure remains a concern, potential breakthroughs or clarifications in these domains could unlock new opportunities for growth in digital payments and fintech innovation.
**Trading Recommendation:**
Given current technical resilience and long-term growth prospects, a LONG position in PayPal is recommended. Traders should carefully monitor regulatory shifts and macroeconomic conditions while taking advantage of the stock’s potential to rebound. Key targets have been outlined for near-term gains while keeping stop-loss levels conservative to mitigate downside risks.

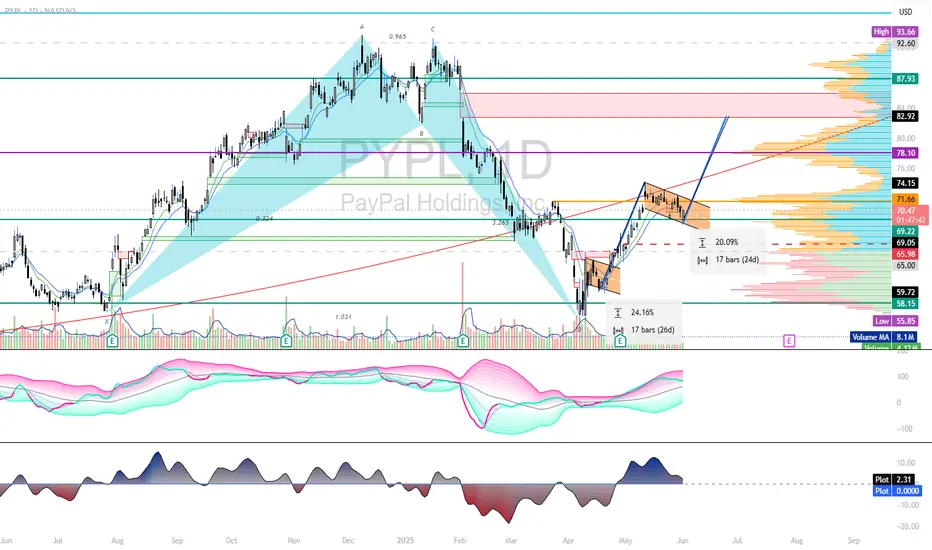
PayPal: Rebound or Rerun?PayPal in 2025: A breakout with backbone or just another spineless fintech?
PayPal is still in the rehabilitation ward after its fall from grace in 2021. Management drama, growth slowdown — the full fintech fatigue package. But something has shifted behind the scenes. A new CEO is cutting costs, AI integration is being whispered about, and earnings have started to surprise again. Wall Street pretends not to notice — but volume tells a different story.
Technically, we’re looking at a well-formed inverse head and shoulders. The neckline stretches from $72.00 to $74.76, aligning with the 0.5 Fibonacci level. A confirmed breakout above this zone opens the path to a clear target at $93.66 — the 1.0 Fibonacci extension. Multiple EMA clusters and strong pattern symmetry reinforce the setup. But no fairy tales here: the real entry comes after a retest. Without confirmation, it’s just another pretty formation for chart enthusiasts.

paypal holding can see its gloriuos days againpay pal has capacity to restore what has been retrace throghout past years if it can hold throuh next 3 weeks. 67$ and 55$ will be significant support at under any circumtances better should not fall. if it can see this targaet after that we coul see if its momentum strong enough to hold for long term like next year

PYPL: Strong Resistance Zone in Play – Watch 73.34 for EntryNASDAQ:PYPL is showing a potential triple top formation near the 73 level. If price breaks above the 73.34 resistance , there's room to move toward 74.15 – a medium-term swing high.
💡 Trade idea: Enter 1 tick above 73.34, set your target and SL based on the 5-minute chart.

Quick View: $PYPLDaily -> Pullback after bullish crossovers of every EMA
Weekly -> Still bearish with test of the price to EMA 50
Watching for a #TopSwing Setup on the Daily Chart
Area of $73.5-$74.5 as key resistance.
Structure is interesting, but I’m waiting for a clear signal.
Support → $65

Break Out needed"Price needs to break out of the Parallel Channel and the 200 EMA (in orange) and the downward trend line and the 72.83 resistance level for some possible bullish action."

"PYPL" short term bullishMACD curling with potential for a retest of VWAP which it has tested twice and failed. A move up to the VWAP zone implies approximately 30% move to the upside. With that being said, the closest support level is in the $57 range.

PYPL looking at further continuation NASDAQ:PYPL has been on our long-term range play stock and we think is kinda ripe for a major upmove soon.
Price action is strong and long-term MACD is back into positive territory. MAintain long-term buy with target at 105.00

Is PayPal's Dominance Built on Tech and Ties?PayPal strategically positions itself at the forefront of digital commerce by combining advanced technological capabilities with key partnerships. A core element of this strategy is the company's robust fraud prevention infrastructure, heavily reliant on sophisticated machine learning. By analyzing vast datasets from its extensive user base, PayPal's systems proactively detect and mitigate fraudulent activities in real time, providing a critical layer of security for consumers and businesses in an increasingly complex online environment. This technological edge is particularly vital in markets facing elevated fraud risks, where tailored solutions offer enhanced protection.
The company actively pursues strategic collaborations to expand its reach and integrate its services into new digital ecosystems. The partnership with Perplexity to power "agentic commerce" exemplifies this, embedding PayPal's secure checkout solutions directly within AI-driven chat interfaces. This move anticipates the future of online shopping, where AI agents will facilitate transactions. Furthermore, initiatives like PayPal Complete Payments demonstrate a commitment to empowering businesses globally, offering a unified platform for accepting diverse payment methods across numerous markets, optimizing financial operations, and reinforcing security measures.
PayPal also adeptly navigates regulatory landscapes to broaden its service offerings and enhance user convenience. Responding to directives like the EU's Digital Markets Act, PayPal has enabled contactless payments on iPhones in Germany, providing consumers with a direct alternative to existing mobile payment options. This ability to leverage regulatory changes to expand accessibility and choice, coupled with its foundational technological strength and strategic alliances, underpins PayPal's assertive approach to maintaining its leadership position in the dynamic global payments market.

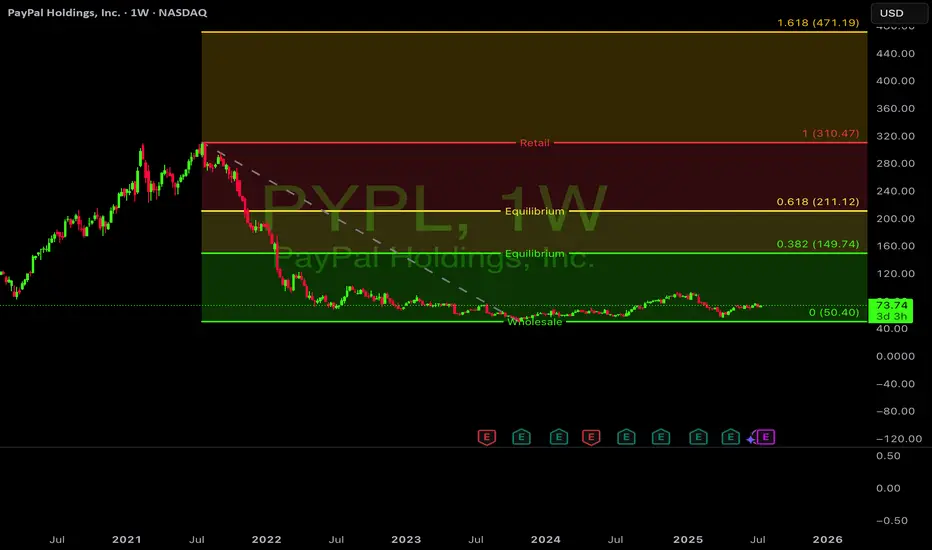
Paypal, due for a small pullback?PayPal has performed well since its low in April.
The RSI is overbought and the price has been rejected at the same Fib-levels as last year.
I'd expect it to continue after reaching the 0.618 Fibonacci level.

PayPal: Upward PressurePYPL has remained under upward pressure, moving significantly closer to the important resistance at $78.86. If the price rises above this level directly, we will have to assume that it has already completed the beige wave alt.II —and thus the overarching corrective movement—with the last notable low. Consequently, in this 45% probable case, the stock would have already entered a new upward cycle, specifically the first wave alt.1 of a turquoise upward impulse. Primarily, however, we expect the stock to imminently reverse downward to complete the regular wave II below the support at $50.18. Only afterward should a new sustainable upward impulse begin—initially driving rises above $94.97.

Indicators that Warn of a Top or Bottom Before It HappensHybrid Leading Indicators use all 3 data sets from each transaction that occurs in the stock market. Today this lesson talks about Chaikin Oscillator and Chaikin MFI. Both are used on the same chart as the volume oscillator reveals the volume and price correlation to what the Dark Pool Buy Side institutions are buying or selling for long term holds. The oscillator also shows pro trader activity and indicates with a spike to the top or bottom of its chart a probable reversal of the trend the next day. When the Oscillator spikes to the top, then a profit taking day by pros or a run down is likely the next day.
When the oscillator hits a V shape at the bottom of the chart, the stock price is likely to move up the next day, warning those selling short to exit quickly. The oscillator also shows topping price and volume changes before the Flat Top forms. It also shows Bottoming development before the recent rebound in $NASDAQ:PYPL.
Money Flowing into or out of a stock is also a critical analysis for swing traders as it confirm whether you should continue swing trading to the upside OR if you should switch quickly to selling short. MFI in this chart is harmonious with the oscillator, both confirming a strong indication of the direction the stock will take over the next few days.
A bottoming formation starts well ahead of the actual final low. This is important to recognize early when selling short, to avoid a huge whipsaw day that can cause huge sell short losses.
When you can read the chart as easily as you read a book, your Spatial Pattern Recognition Skills are finely tuned and you can be proud to be a member of the semi-professional retail swing traders. Let that be your goal, along with consistent profits with minimal losses.
Raise your expectations.
Trade Wisely,
Martha Stokes CMT

Market analysts remain confident in PayPal's long-term prospects**Direction:** **LONG**
**LONG Targets:**
- **T1 = $67.50**
- **T2 = $68.90**
**Stop Levels:**
- **S1 = $63.00**
- **S2 = $60.50**
**Wisdom of Professional Traders:**
This analysis synthesizes insights from thousands of professional traders and market experts, leveraging collective intelligence to identify high-probability trade setups. The wisdom of crowds principle suggests that aggregated market perspectives from experienced professionals often outperform individual forecasts, reducing cognitive biases and highlighting consensus opportunities in PayPal.
**Key Insights:**
PayPal's stock performance reflects broader fintech struggles despite its solid earnings and robust business fundamentals. The company's strategic initiatives, including Buy Now, Pay Later offerings and cryptocurrency integration, position it well for mid- to long-term growth. External challenges such as economic headwinds and regulatory uncertainties are likely to impact near-term momentum. Traders view PayPal as a fintech leader poised for recovery in a competitive market environment, making it a strong candidate for an upside price swing.
**Recent Performance:**
PayPal's recent price movements have been subdued, largely tied to wider macroeconomic concerns and fintech sector underperformance. Despite reporting strong earnings, maintaining solid business resilience, and bolstering key offerings, its stock price has struggled to gain traction due to cautious investor sentiment. Notably, the stock has exhibited periods of consolidation around its current levels, suggesting potential for a breakout upon improved market conditions.
**Expert Analysis:**
Market analysts remain confident in PayPal's long-term prospects, favoring its strong fundamentals and future opportunities driven by key initiatives across payments and technology integration. Resistance in breaking above the $65-$68 range has been noted, with technical indicators suggesting upward potential upon overcoming immediate challenges. However, fintech sector competition and sensitivity to regulatory developments remain as notable risks.
**News Impact:**
Recent news has positioned PayPal among major earnings reports alongside tech leaders such as Amazon and Apple. While the attention highlights its critical role in the digital payments space, fintech's sluggish sector performance, competition from established players like Square, and macroeconomic factors tied to interest rates and consumer behavior have contributed to recent stock price lethargy.
**Trading Recommendation:**
Based on aggregated insights, the outlook for PayPal next week supports a long position. The company's solid fundamentals and market-leading strategies present strong upside potential, especially nearing breakout levels in the mid-$65 range. Traders aiming to capitalize on fintech recovery trends should consider long entry points while maintaining prudent stop levels to mitigate broader market risks.

PayPal: Slight Recovery!In recent days, PYPL shares showed a significant recovery, raising the central question of whether the price will indeed dive into deeper territories once more, as assumed in our primary scenario. In this case, we expect the stock to fall below the support at $50.18. There, the stock should form the final low of the overarching beige wave II, thus laying the foundation for a sustainable trend reversal. Alternatively, the overarching low may have already been settled at the beginning of the month. In this 45% likely scenario, the recovery would imminently gain momentum, allowing PYPL to sustainably rise above the resistance levels at $78.86 and $94.97.

PAPL - Good epxectation for earnings, collect potential?Hi guys we would be looking into Paypal Today
Analysts maintain a "Moderate Buy" consensus on PYPL, with 17 buy, 17 hold, and 2 sell ratings. The average 12-month price target is $84.69, suggesting a potential upside of about 29.6% from the current price. Price targets range from $49 to $125.
Earnings Performance
In the most recent quarter, PayPal reported adjusted earnings per share (EPS) of $1.20, a 22% year-over-year increase, surpassing expectations. However, revenue grew by 6% to $7.85 billion, slightly below forecasts. Notably, PayPal has exceeded EPS estimates in each of the last four quarters.
Growth Initiatives and Strategic Outlook
Branded Checkout Enhancements: Efforts to improve user experience and competitiveness against rivals like Apple Pay
Venmo Monetization and Debit Card Expansion: Initiatives to increase revenue through Venmo and broader payment options.
Fastlane Guest Checkout: A new feature aimed at streamlining the checkout process, with significant monetization expected in 2025.
Valuation and Future Prospects
PayPal's current valuation at 14 times forward 2025 earnings is below its five-year average P/E of 50.5, indicating potential for multiple expansion. Forecasts suggest revenue could reach $35.1 billion in 2025, with EPS around $4.93.
Our Conclusion
Given its strategic initiatives, consistent earnings performance, and favorable valuation, PayPal appears poised for growth. While challenges like competition in digital payments persist, the company's focus on innovation and user experience may drive its stock price upward in the coming years.
📌 Trade Plan
📈 Entry: 65.50
✅ Target: 75.50 - Targeting the weak resistance
❌ SL: 55.50 - protecting the trade above the bottom zone

Trading Analysis for PayPal
**Current Price:** $64.77
**Direction:** **LONG**
**LONG Targets:**
- **T1 = $66.50**
- **T2 = $68.00**
**Stop Levels:**
- **S1 = $62.50**
- **S2 = $60.00**
---
**Wisdom of Professional Traders:**
This analysis synthesizes insights from thousands of professional traders and market experts, leveraging collective intelligence to identify high-probability trade setups. The wisdom of crowds principle suggests that aggregated market perspectives from experienced professionals often outperform individual forecasts, reducing cognitive biases and highlighting consensus opportunities in PayPal.
**Key Insights:**
PayPal is entering a crucial phase ahead of its Q3 earnings report, which is expected to show marginal declines in earnings per share (EPS) to $1.16 and modest revenue growth of 1.8% to $7.84 billion. Despite these challenges, the company continues to maintain stability via its core business model. Traders are keenly watching for updates on metrics such as transaction growth, active accounts, and cost-saving initiatives, as they are crucial to future market sentiment. The stock remains below technical resistance, suggesting price movements are likely to remain in a defined range unless a material catalyst occurs.
**Recent Performance:**
Over the last few months, PayPal has been underperforming relative to the broader tech sector. Weak trading volume and an inability to sustain upward momentum reflect investor concerns regarding competition from emerging fintech players and margin compression. Despite broader tech recovery, PayPal’s growth stock identity has been overshadowed by these concerns, leading to bearish sentiment in its recent price actions.
**Expert Analysis:**
Experts note that PayPal is facing challenges both externally, through macroeconomic pressures, and internally, from difficulties in scaling EPS growth and user engagement. However, its strong position as a key player in digital payments still attracts optimism among institutional investors. Analysts stress the importance of the company’s post-earnings guidance, viewing updates on strategies for boosting active users and enhancing profitability as potentially pivotal for shifting sentiment.
**News Impact:**
The upcoming earnings report places PayPal in the center of a busy week for tech stocks, sharing the spotlight with sector giants such as Meta, Amazon, Visa, and Snap. Sector-wide results may influence PayPal’s performance in the short term. Recent news highlights the increasing competition PayPal faces from both traditional institutions and newer fintech players; however, its ability to innovate and retain market share remains a core focus for investors seeking long-term gains.
---
**Trading Recommendation:**
PayPal’s current price level offers a potential opportunity for a LONG position targeting a recovery to $66.50 and $68.00, assuming earnings and guidance provide a positive surprise. With stop-loss levels defined at $62.50 and $60.00, risk management is key given external macroeconomic challenges and internal operational headwinds. This setup aligns with professional consensus, combining defined upside potential with manageable downside risk.
```

Paypal to the moon 93 dollar until octoberYou can see the futures! This is paypal. It is going to make the 100 dollar this year. Just check the video and enjoy it. peace.
