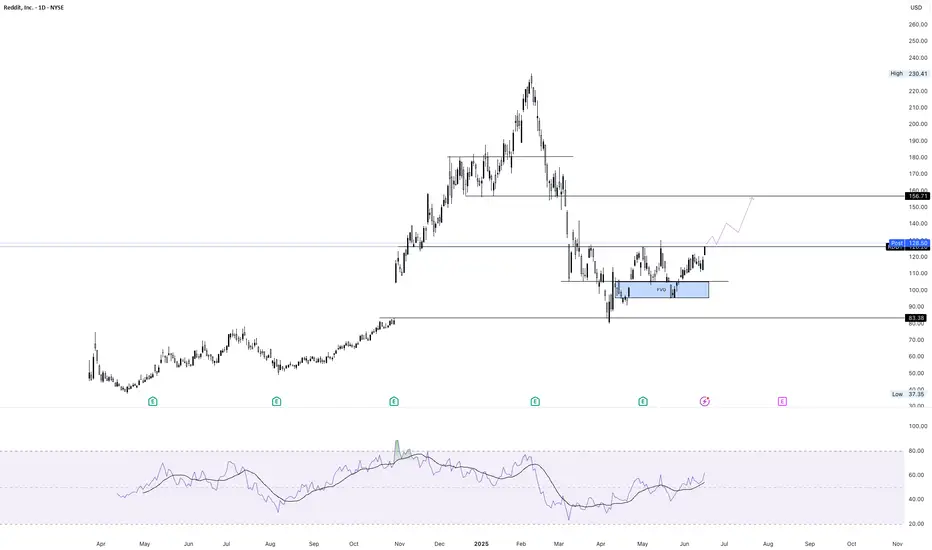
$RDDT Long Setup – Bullish BreakoutReddit ( NYSE:RDDT ) has broken out above the Ichimoku Cloud on the daily chart, signaling a potential shift in trend. Momentum is building with MACD pushing higher and no signs of divergence, showing continued strength. While this trade offers a solid 2.1 risk/reward setup (entry at $134.14, stop a
Next report date
—
Report period
—
EPS estimate
—
Revenue estimate
—
1 EUR
−467.80 M EUR
1.26 B EUR
114.42 M
About Reddit
Sector
Industry
CEO
Steven Ladd Huffman
Website
Headquarters
San Francisco
FIGI
BBG01QK6XVV6
Reddit, Inc. operates an entertainment, social networking, and news website where registered community members can submit content. It provides online news services where users can select and rank web content. The firm also offers a personalized filter on the day's story, using previous votes to determine what new things the user might like to read. The company was founded by Steven Ladd Huffman and Alexis Ohanian on June 23, 2005 and is headquartered in San Francisco, CA.
Related stocks

Reddit - Long & StrongOn the 10th of March I posted about Reddit, as it lost the $120 level I advised the bulls to get ready to buy in at $80, which was the gap fill area met with the confluence of the 0.786 Fib level. We remained patient at went long at $82, with a stop loss under the 0.786 at $78. That move is now payi

Reddit breaks out for bullish run I have been watching Reddit for a couple of weeks and identified that we had put in the .786 low from the correction since February and then formed a range that was well respected for the past 4 months .
In this video I highlight zones where i expect price to gravitate too and where a nice entry w

Let's Buy Reddit TodayTrading Fam,
After missing an initial entry on Reddit when my indicator gave me a buy, we double-topped and then came back down into our liquidity block. This has given me a second chance for a decent entry. I will be targeting $158-170 with a SL currently set at $75.
Stew

Reddit Long ideaReddit stock filled the earnings gap from Oct 2024 — clean bullish reversal + retest. Looks like it's heading for the next resistance zone. Planning to swing this one up toward the $150–156 range.

Bullish on RDDT - Can it clear 130 and hold this time?Key levels to watch
Support: 108–110. This zone held on the most recent pullback and aligns with prior structure.
Short-term target: 125–126. If price breaks and holds above this level, it suggests momentum is building.
Overhead Resistance: 130. Clearing and holding above this level is wha

RDDT Weekly Trade Plan – 2025-06-06🚀 RDDT Weekly Trade Plan – 2025-06-06
Bias: Moderately Bullish
Timeframe: 1-day (0DTE)
Catalyst: Momentum continuation, supportive VIX, strong short-term technicals
Trade Type: Naked call option
🧠 Model Summary Table
Model Direction Strike Entry Price Target Gain Stop-Loss Confidence
Grok Moderatel

RDDT - Inverse Head & Shoulder [MID-TERM]NYSE:RDDT Reddit broke through a falling trend channel, suggesting a potential inverse head & shoulder pattern. Support is at $87 and resistance at $224.

RDDT Swing Options Outlook —June 1, 2025📈 RDDT Swing Options Outlook — May 31, 2025
🚨 AI Consensus: Bullish Momentum with Legal Risk Overhang
🧠 Model Breakdown
🔹 Grok (xAI)
Bias: Bullish
Technicals: Above all key EMAs; RSI overbought; MACD strong.
Sentiment: Positive earnings, legal uncertainty.
Trade: Buy $113C @ $5.90 → PT +20%, S

See all ideas
Summarizing what the indicators are suggesting.
Neutral
SellBuy
Strong sellStrong buy
Strong sellSellNeutralBuyStrong buy
Neutral
SellBuy
Strong sellStrong buy
Strong sellSellNeutralBuyStrong buy
Neutral
SellBuy
Strong sellStrong buy
Strong sellSellNeutralBuyStrong buy
An aggregate view of professional's ratings.
Neutral
SellBuy
Strong sellStrong buy
Strong sellSellNeutralBuyStrong buy
Neutral
SellBuy
Strong sellStrong buy
Strong sellSellNeutralBuyStrong buy
Neutral
SellBuy
Strong sellStrong buy
Strong sellSellNeutralBuyStrong buy
Displays a symbol's price movements over previous years to identify recurring trends.
Frequently Asked Questions
The current price of 1RDDT is 126 EUR — it has decreased by −2.33% in the past 24 hours. Watch REDDIT INC stock price performance more closely on the chart.
Depending on the exchange, the stock ticker may vary. For instance, on MIL exchange REDDIT INC stocks are traded under the ticker 1RDDT.
1RDDT stock has risen by 5.00% compared to the previous week, the month change is a 31.25% rise, over the last year REDDIT INC has showed a 66.05% increase.
We've gathered analysts' opinions on REDDIT INC future price: according to them, 1RDDT price has a max estimate of 208.26 EUR and a min estimate of 64.01 EUR. Watch 1RDDT chart and read a more detailed REDDIT INC stock forecast: see what analysts think of REDDIT INC and suggest that you do with its stocks.
1RDDT reached its all-time high on Feb 10, 2025 with the price of 224 EUR, and its all-time low was 73 EUR and was reached on Apr 7, 2025. View more price dynamics on 1RDDT chart.
See other stocks reaching their highest and lowest prices.
See other stocks reaching their highest and lowest prices.
1RDDT stock is 7.20% volatile and has beta coefficient of 2.30. Track REDDIT INC stock price on the chart and check out the list of the most volatile stocks — is REDDIT INC there?
Today REDDIT INC has the market capitalization of 23.59 B, it has increased by 19.97% over the last week.
Yes, you can track REDDIT INC financials in yearly and quarterly reports right on TradingView.
REDDIT INC is going to release the next earnings report on Aug 12, 2025. Keep track of upcoming events with our Earnings Calendar.
1RDDT earnings for the last quarter are 0.12 EUR per share, whereas the estimation was 0.02 EUR resulting in a 647.47% surprise. The estimated earnings for the next quarter are 0.16 EUR per share. See more details about REDDIT INC earnings.
REDDIT INC revenue for the last quarter amounts to 362.71 M EUR, despite the estimated figure of 341.59 M EUR. In the next quarter, revenue is expected to reach 360.56 M EUR.
1RDDT net income for the last quarter is 24.18 M EUR, while the quarter before that showed 68.62 M EUR of net income which accounts for −64.76% change. Track more REDDIT INC financial stats to get the full picture.
No, 1RDDT doesn't pay any dividends to its shareholders. But don't worry, we've prepared a list of high-dividend stocks for you.
As of Jul 2, 2025, the company has 2.23 K employees. See our rating of the largest employees — is REDDIT INC on this list?
EBITDA measures a company's operating performance, its growth signifies an improvement in the efficiency of a company. REDDIT INC EBITDA is 44.79 M EUR, and current EBITDA margin is −41.91%. See more stats in REDDIT INC financial statements.
Like other stocks, 1RDDT shares are traded on stock exchanges, e.g. Nasdaq, Nyse, Euronext, and the easiest way to buy them is through an online stock broker. To do this, you need to open an account and follow a broker's procedures, then start trading. You can trade REDDIT INC stock right from TradingView charts — choose your broker and connect to your account.
Investing in stocks requires a comprehensive research: you should carefully study all the available data, e.g. company's financials, related news, and its technical analysis. So REDDIT INC technincal analysis shows the strong buy rating today, and its 1 week rating is buy. Since market conditions are prone to changes, it's worth looking a bit further into the future — according to the 1 month rating REDDIT INC stock shows the strong sell signal. See more of REDDIT INC technicals for a more comprehensive analysis.
If you're still not sure, try looking for inspiration in our curated watchlists.
If you're still not sure, try looking for inspiration in our curated watchlists.