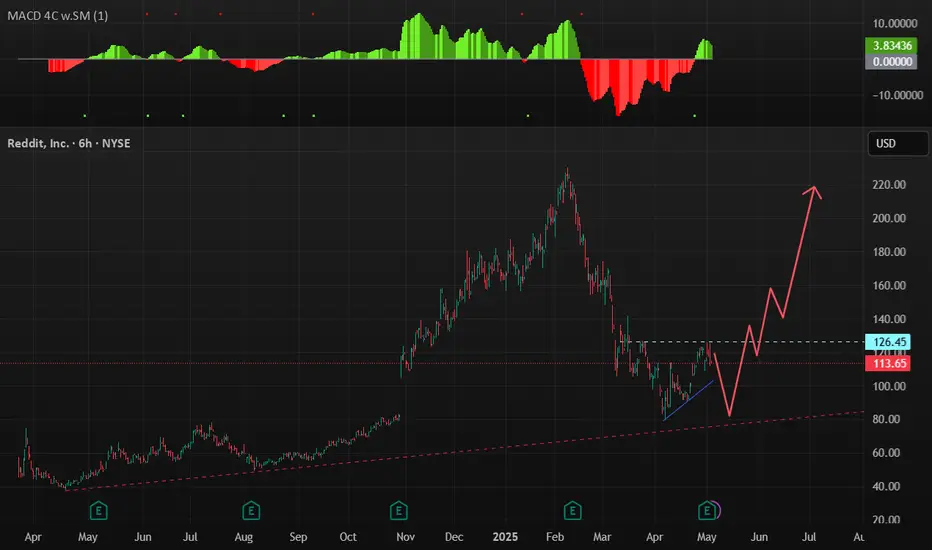
Feel like Reddit might be worth a watch. Managed to fill that gap where it ran hard from previously.
MACD below that 0 line and looks like its showing signs of momentum coming back in.
Might be worth keeping an eye on.
1RDDT trade ideas

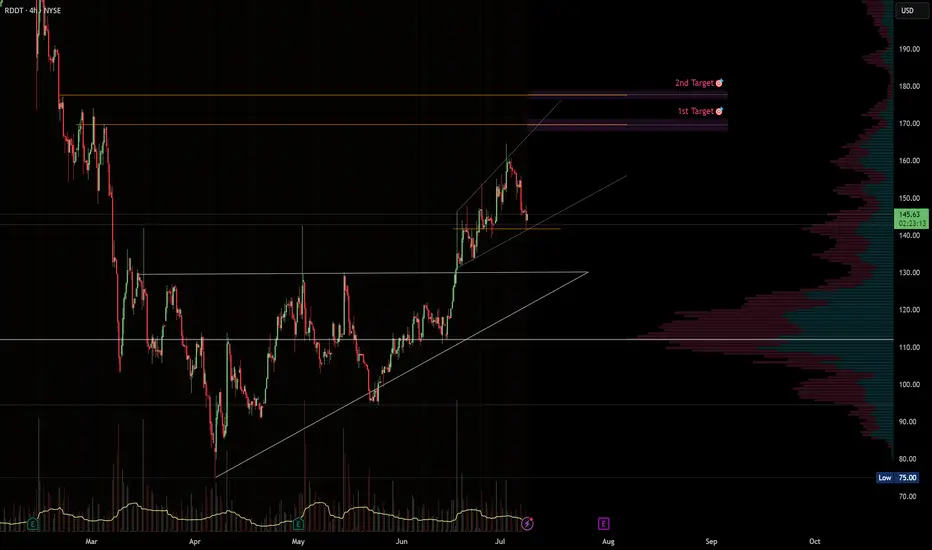
RDDT · 4H — Rising-Wedge Setup with Targets at $172 and $185Setup Summary
Rising wedge structure forming since late June. Price recently pulled back to test support at ~$144–145, where the rising trendline intersects horizontal structure.
Momentum remains bullish: The prior move from $110 to $165 was impulsive, and this consolidation appears corrective so far.
Volume profile (VPVR) shows a thin liquidity zone between $150 and $172, suggesting a strong move is likely if the $150 level is reclaimed.
---
🎯 Target Zones
Target Level Rationale
1st Target $169 Matches wedge breakout projection + aligns with prior IPO supply and volume gap resistance.
2nd Target $177 Psychological round number + coincides with IPO opening print and the highest rejection wick seen so far.
---
🛠️ Trade Plan
Component Level
Trigger Entry on bounce from $144 or breakout/reclaim of $150.
Invalidation Close below $142 breaks wedge structure.
TP-1 $172 – take 50–70% off, move stop to breakeven.
TP-2 $185 – runner target; exit if price shows rejection.
---
⚠️ Risk Notes
Wedge patterns can fake out — wait for confirmation (e.g. a 4H bullish engulfing or volume reclaim above $148–150).
Earnings or lock-up expiration could introduce volatility (check calendar).
If support at $143 fails, look for next demand at $134–135 (prior breakout base).
---
✅ Checklist
Structure: Rising wedge in uptrend
Support: Held above previous breakout zone
Volume profile: Favorable thin zone toward $172
Risk defined below $142
> Disclaimer: This idea is for educational purposes only. Trade your own plan and always use proper risk management.
Reddit, how much further?NYSE:RDDT might want to consolidate here and build a flag before launching further
down trendline from ATH is acting as resistance
also there is some supply from 160-180 to go through
forming quite a nice rounding bottom here
could go straight up too... who knows

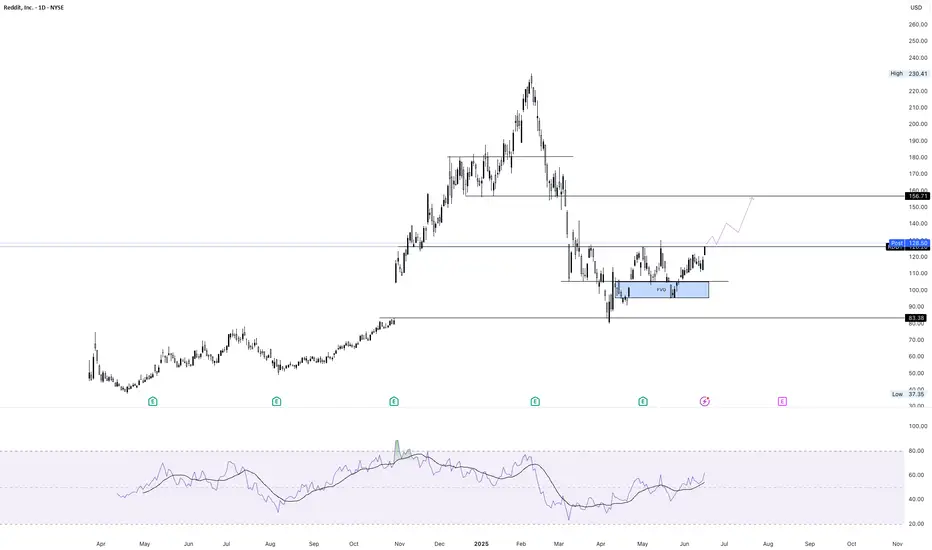
Reddit Long ideaReddit stock filled the earnings gap from Oct 2024 — clean bullish reversal + retest. Looks like it's heading for the next resistance zone. Planning to swing this one up toward the $150–156 range.
Reddit, Inc. (RDDT) – Global Growth & Monetization TailwindsCompany Snapshot:
Reddit NYSE:RDDT is a community-centric social media platform, uniquely positioned through user-generated content and authentic engagement. With over 100,000 active communities, Reddit is a magnet for targeted brand advertising and premium ad formats.
Key Catalysts:
AI-Driven International Expansion 🌐
Launched AI-powered post translation in 35+ countries, including Brazil, Germany, and Italy.
This unlocks new audiences and ad monetization in high-growth global markets.
High Margin Business Model 💸
Reported a 90.5% gross margin—highlighting Reddit’s asset-light infrastructure and operational efficiency.
Sets the stage for significant operating leverage as revenue scales.
Ad Revenue Acceleration 📊
Brands increasingly view Reddit as a premium ad environment, given its contextual targeting and deep user engagement.
Expanding tools for advertisers (e.g., Dynamic Product Ads) may enhance monetization per user.
Investment Outlook:
Bullish Entry Zone: Above $120.00–$122.00
Upside Target: $190.00–$195.00, supported by global reach, margin strength, and ad revenue tailwinds.
🧠 Reddit isn’t just a social platform—it’s a monetizable network of influence, fueled by community trust and scalable technology.
#Reddit #RDDT #SocialMediaStocks #AIExpansion #GrossMargin #AdTech #CommunityEngagement #TechStocks #Bullish #DigitalAds #UserGeneratedContent #GlobalGrowth #FreeCashFlow #GrowthStocks

$RDDT Long Setup – Bullish BreakoutReddit ( NYSE:RDDT ) has broken out above the Ichimoku Cloud on the daily chart, signaling a potential shift in trend. Momentum is building with MACD pushing higher and no signs of divergence, showing continued strength. While this trade offers a solid 2.1 risk/reward setup (entry at $134.14, stop at $108.80, target at $188.34), the current entry is not ideal—price is extended from support, and the breakout has already moved significantly. However, the structure still points to bullish continuation. If RDDT can hold above the $130–$135 zone, there’s room to run into the $180s and potentially beyond. A pullback toward the breakout zone would offer a stronger entry, but the upside here remains attractive for a swing trade. This setup is best approached with smaller size or added confirmation if chasing.

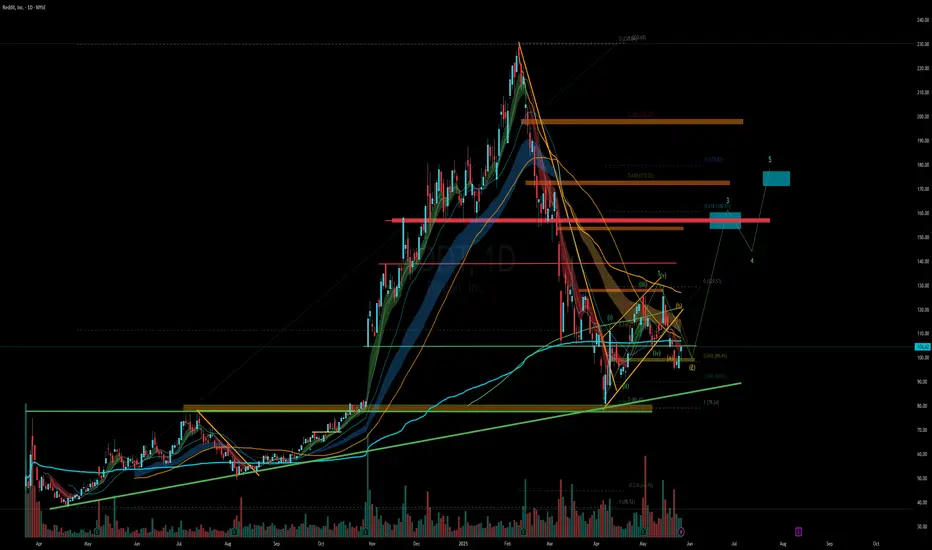
Reddit - Long & StrongOn the 10th of March I posted about Reddit, as it lost the $120 level I advised the bulls to get ready to buy in at $80, which was the gap fill area met with the confluence of the 0.786 Fib level. We remained patient at went long at $82, with a stop loss under the 0.786 at $78. That move is now paying off, as we are up 50% from these levels. Congratulations to those paying attention, we are reaping the rewards of this trade. We had the initial strong bounce to $130, I also said at this point we will likely have another chance to accumulate under $100 - check the minds section - indeed that happened and here we are again 18% from $100.
So what's next? I am seeing continued sign of strength on the charts. This was aided by the recent development that Reddit is suing Anthropic for using their data, despite repeated warnings from Reddit. This stock has a strong technical and fundamental reason to remain bullish.
I'm taking this one step at a time. There's no doubt it is a volatile stock, I think we have put in the lows for now and we continue the path towards $150. But this market can flip at any time, all it takes is post on X to send the entire market into chaos. So be mindful of the risks.
But we remain long and strong here. We didn't fomo into the stock, and we don't plan to panic sell out of it. That is my philosophy.
Not financial advice.

Reddit breaks out for bullish run I have been watching Reddit for a couple of weeks and identified that we had put in the .786 low from the correction since February and then formed a range that was well respected for the past 4 months .
In this video I highlight zones where i expect price to gravitate too and where a nice entry will be if you are looking to long reddit.
Tools used Fib suite , trend based fib , tr pocket , 0.786 + 0.382 and fixed range .

Let's Buy Reddit TodayTrading Fam,
After missing an initial entry on Reddit when my indicator gave me a buy, we double-topped and then came back down into our liquidity block. This has given me a second chance for a decent entry. I will be targeting $158-170 with a SL currently set at $75.
Stew


Bullish on RDDT - Can it clear 130 and hold this time?Key levels to watch
Support: 108–110. This zone held on the most recent pullback and aligns with prior structure.
Short-term target: 125–126. If price breaks and holds above this level, it suggests momentum is building.
Overhead Resistance: 130. Clearing and holding above this level is what would turn this from a bounce into something with more swing potential.
Upside potential: 155–166, if price can build a base above 130
While the structure is building constructively, and a decline from here isn't my first pick, it is possible that we just continue to chop. But, for now I am bullish on RDDT for the next few weeks, and I will continue to update you here as it plays out.

RDDT Weekly Trade Plan – 2025-06-06🚀 RDDT Weekly Trade Plan – 2025-06-06
Bias: Moderately Bullish
Timeframe: 1-day (0DTE)
Catalyst: Momentum continuation, supportive VIX, strong short-term technicals
Trade Type: Naked call option
🧠 Model Summary Table
Model Direction Strike Entry Price Target Gain Stop-Loss Confidence
Grok Moderately Bullish $118 CALL ~$0.68 +25% –30% 75%
Claude Moderately Bearish $115 PUT ~$0.74 +50–100% –50% 72%
Llama Moderately Bullish $119 CALL ~$0.66 +10–15% support break 70%
Gemini Moderately Bullish $120 CALL ~$0.58 +50–100% –50% 65%
DeepSeek Moderately Bullish $118 CALL ~$0.68 +50% –50% 65%
✅ Consensus: Momentum-driven upside with support from trend, RSI, MACD
⚠️ Disagreement: Claude bearish due to max pain gravity and fading M5 momentum
📉 Technical & Sentiment Summary
Trend: Price above EMAs, RSI positive, MACD confirms momentum
Resistance: $117.30–$117.73 zone to clear before $119 strike in play
Sentiment: VIX falling, news cycle supportive
Max Pain: $113 – downside gravity risk if momentum stalls
Liquidity: Decent OI on $118–$120 strikes; spreads could widen at open
✅ Final Trade Setup
Parameter Value
Instrument RDDT
Direction CALL (LONG)
Strike $119
Expiry 2025-06-06 (0DTE)
Entry Price $0.66
Profit Target $0.99 (≈+50%)
Stop Loss $0.33 (≈–50%)
Size 1 contract
Entry Timing At market open
Confidence 70%
💡 Rationale: Balanced strike with reasonable premium and realistic target before EOD, while staying inside momentum breakout range.
⚠️ Key Risks & Considerations
Theta decay: Time erosion steep on 0DTEs—move must be fast and early
Max pain: $113 could anchor the stock if resistance isn’t cleared
Resistance: Cluster around $117.30–$117.73 needs break for $119 test
Open volatility: Bid-ask spreads could widen—consider limit entry
📊 TRADE DETAILS SNAPSHOT
🎯 Instrument: RDDT
🔀 Direction: CALL (LONG)
🎯 Strike: 119.00
💵 Entry: $0.66
🎯 Target: $0.99
🛑 Stop: $0.33
📅 Expiry: 2025-06-06
📏 Size: 1
📈 Confidence: 70%
⏰ Entry: Open
🕒 Signal Time: 2025-06-06 11:29:24 EDT

RDDT - Inverse Head & Shoulder [MID-TERM]NYSE:RDDT Reddit broke through a falling trend channel, suggesting a potential inverse head & shoulder pattern. Support is at $87 and resistance at $224.

RDDT Swing Options Outlook —June 1, 2025📈 RDDT Swing Options Outlook — May 31, 2025
🚨 AI Consensus: Bullish Momentum with Legal Risk Overhang
🧠 Model Breakdown
🔹 Grok (xAI)
Bias: Bullish
Technicals: Above all key EMAs; RSI overbought; MACD strong.
Sentiment: Positive earnings, legal uncertainty.
Trade: Buy $113C @ $5.90 → PT +20%, SL −30%
Confidence: 75%
🔹 Claude (Anthropic)
Bias: Bearish
Technicals: Overbought short-term; resistance at $113.90.
Sentiment: Fraud probe risk; Max Pain = $105.
Trade: Buy $110P @ $4.90 → PT $7.50/$10.00, SL $3.50
Confidence: 75%
🔹 Llama (Meta)
Bias: Bullish
Technicals: Bullish across 15m & daily; weekly catching up.
Sentiment: Strong earnings reaction; risk underpriced.
Trade: Buy $115C @ $5.05 → PT $7.50, SL $3.50
Confidence: 85%
🔹 Gemini (Google)
Bias: Bullish
Technicals: Strong daily trend, near resistance.
Trade: Buy $120C @ $3.35 → PT $5.00/$5.85, SL $2.00
Confidence: 70%
🔹 DeepSeek
Bias: Bullish
Technicals: MACD bullish, overbought signs visible.
Sentiment: Call OI > Put OI; Max Pain drag noted.
Trade: Buy $113C @ $5.45 → PT $6.81/$8.18, SL $3.80
Confidence: 75%
✅ Consensus Summary
✅ 4 of 5 models lean bullish, citing strong earnings and upside momentum
📈 Price is above all major EMAs; MACD and volume support upside
🧲 Max Pain @ $105 may create drag into expiry
⚠️ Short-term RSI is hot → watch for early week pullback
🎯 Recommended Trade
💡 Strategy: Swing Long Naked Call (2-week expiry)
🔘 Ticker: RDDT
🔀 Direction: CALL (LONG)
🎯 Strike: $115.00 (slightly OTM, liquid with OI 657)
💵 Entry: $5.05
🎯 Profit Target: $7.50 (+48%)
🛑 Stop Loss: $3.50 (−30%)
📏 Size: 1 Contract
📅 Expiry: 2025-06-13
⏰ Entry Timing: Market Open
📈 Confidence: 75%
⚠️ Risks and Considerations
📉 RSI is overbought—expect possible fade early week
🧲 Max Pain at $105 could slow gains by expiration
📰 Any legal investigation update could inject volatility
⌛ 2-week expiry gives room, but theta ramps after day 5
📊 TRADE DETAILS (JSON)
json
Copy
Edit
{
"instrument": "RDDT",
"direction": "call",
"strike": 115.0,
"expiry": "2025-06-13",
"confidence": 0.75,
"profit_target": 7.50,
"stop_loss": 3.50,
"size": 1,
"entry_price": 5.05,
"entry_timing": "open",
"signal_publish_time": "2025-06-01 09:30:00 UTC-04:00"
}

RDDT - Ready for Round 2?RDDT is setting up a base here, let's see if it holds this previous support level around 80.
Target 1 - 160
Target 2 - 180
Stop loss - 75
$RDDT is setup for a big fall! 44% DownsideI was looking at a bullish setup on NYSE:RDDT but it invalidated and the bearish setup is way stronger!
Bear Flag Breakdown = MM of $61.81 🎯
- Below H5_L indicator
- Breaking down out of bear flag
- Below volume shelf with GAP to fill
- Bearish WCB formed

$RDDT – Big Move Incoming? 38% Upside🚀 NYSE:RDDT – Big Move Incoming?
🔥 Daily: Inverse H&S nearing breakout—above $131.50, target $182.30 (+38%) 🚀
📈 Weekly: Bearish WCB breakout → Uptrend in motion. If Inverse H&S confirms, bullish combo sets up a big move!
This train is moving—watch for the breakout! 🚊💰

RDDT on sale again today: buying feels hardest when it’s downWatching NYSE:RDDT today, it’s clear the market is still undecided. Is this dip another chance to add, or just a pause before the next run?
It’s a classic market paradox: When prices fall, fear grips the crowd, and conviction weakens. Yet, when stocks soar, like NYSE:RDDT did with a +12% jump yesterday, confidence floods back, and everyone wants in.
This behavior isn’t unique to $RDDT. It’s a psychological trap that can keep investors chasing gains instead of buying value.
Technically, NYSE:RDDT has strong support between 107 and 114.
The real edge? Learning to act opposite to that instinct, buying when others hesitate, selling when everyone’s euphoric. Easier said than done, but that’s how alpha is made.
The market often rewards those who can sit with discomfort and make moves when the crowd won’t.

Reddit making a come back after correction NYSE:RDDT is looking at a potential comeback after the stock managed to stay intact within the uptrend line of more than a year (started since April 2024). Inverted head and shoulder was spotted at the support and is looking at a potential breakout to the upside!
Both 23-period ROC and mid-term stochastic oscillators are showing signs of oversold, which increase the chance of breaking above.

[RDDT] Trade ideaInvestment idea on this stock, looks very interesting for me.
H&S pattern in formation for now so too soon to say but can be anticipated ...
Great Trade !

RDDT put saleOwning at $90 is a GIFT!! But, $100 is JUST aggressive enough AND the premium is really nice, even though it's 12% away?!
We had a beautiful gap up today on RDDT. with this being less than 2 weeks, I dig it.
:)

RDDT - Possible bottom and bullish setupYou have an inverse H&S, bullish TK Cross and a E2E trade opportunity (top of the red ichimoku cloud target).
With outstanding earnings, this stock should follow this setup.

Huge Potential for the REDDIT (RDDT)Reddit stock offers significant upside potential, with analyst price targets suggesting 72–161% gains, driven by robust revenue growth, user expansion, advertising improvements, and AI data licensing opportunities. Its unique position as a community-driven platform and strong institutional backing (e.g., $5.2 billion in Q4 2024) further bolster its case. However, risks include dependency on Google’s algorithm, a historically unprofitable track record, high valuation concerns, and potential market volatility. Investors should weigh these factors and conduct thorough research, as Reddit’s growth story is compelling but not without challenges.