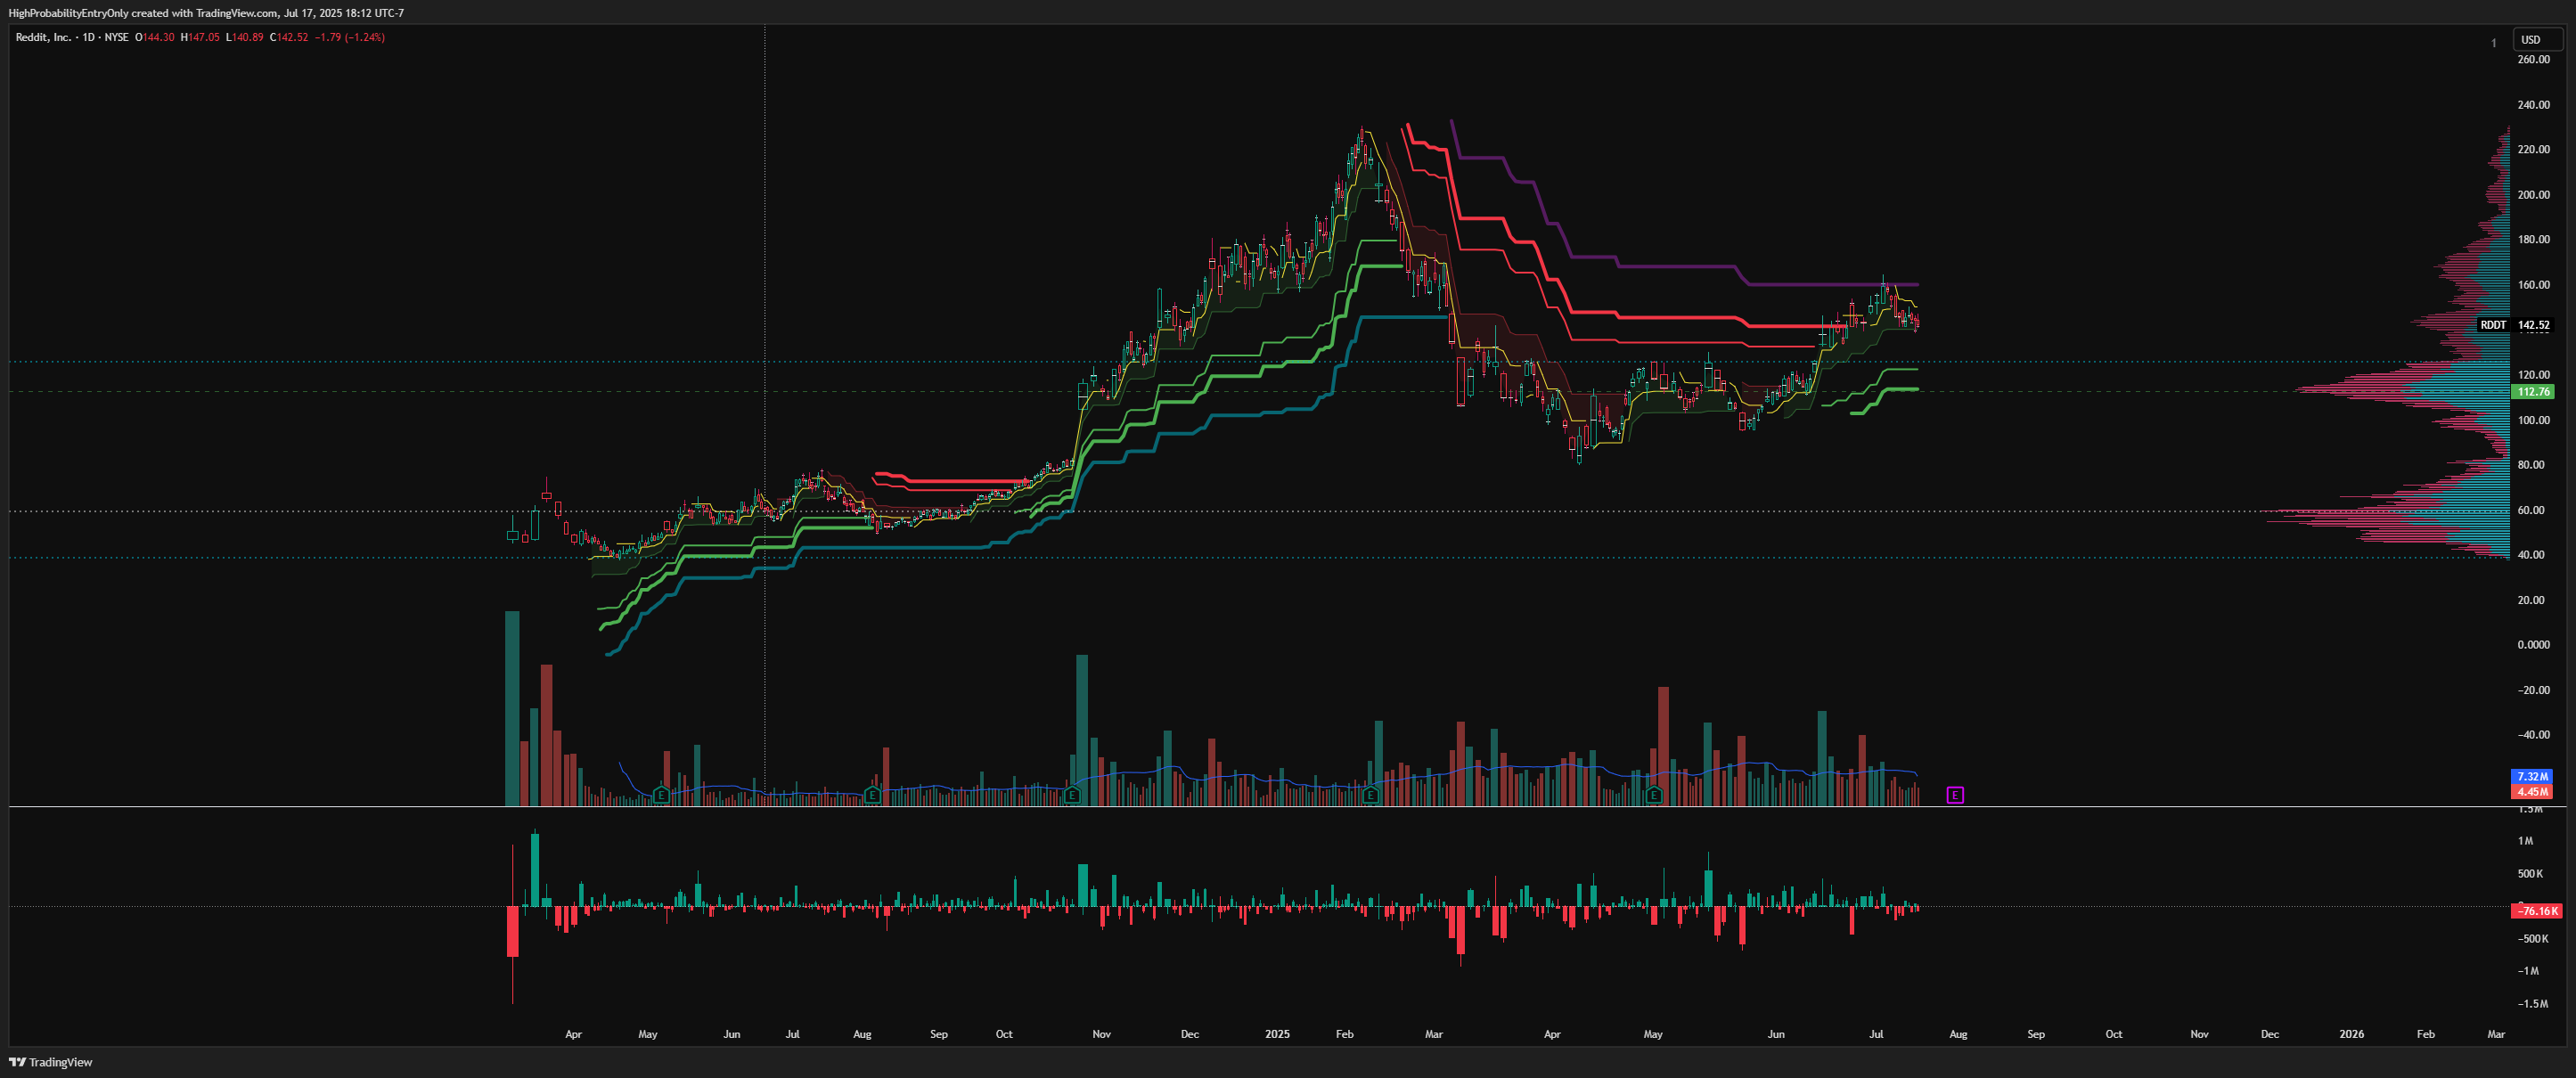
RDDT ideal buy zone 120 earnings, setup currently hints at a negative shock; trend entry at 140 on the daily, weak rebound, uncertain conviction, move your stop loss to 132, im not longing rddt at this level until key level is hit (which is actually 112 for me).
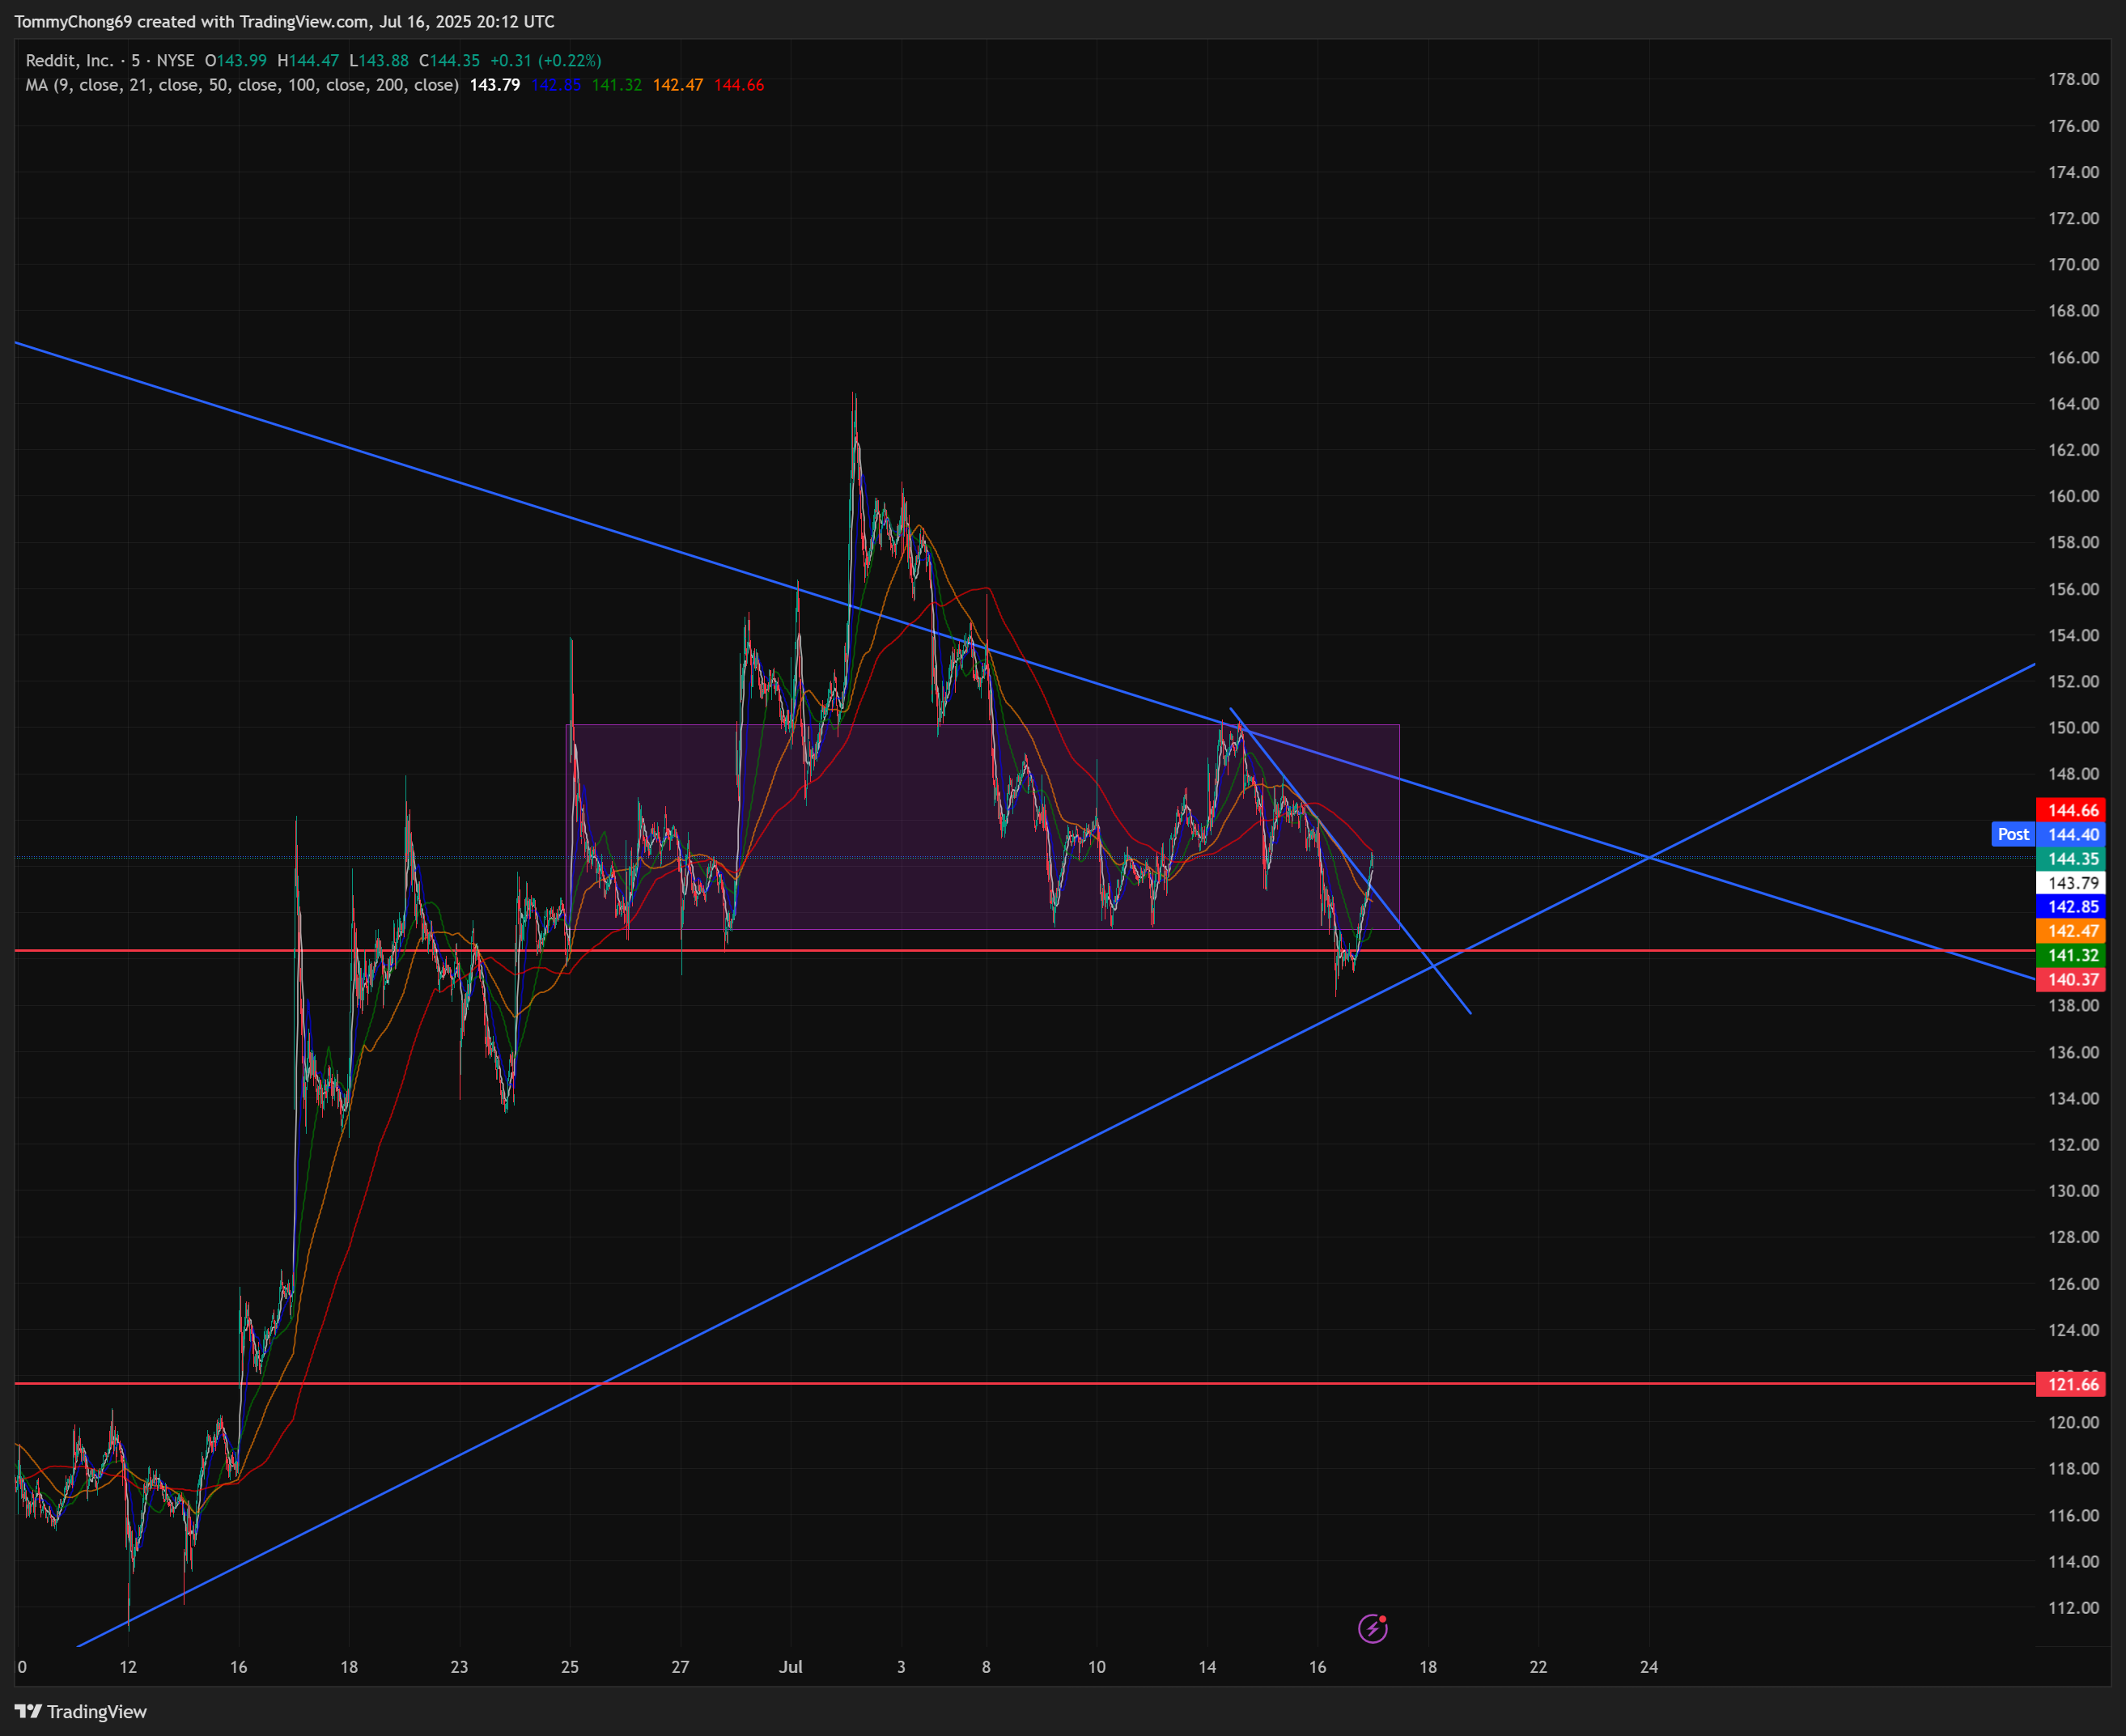
RDDT Price is reacting constructively at the key resistance zone highlighted earlier. On the micro level, it may be already forming a higher low at local support setting the stage for a move toward the 178–200 resistance zone.
As long as price is closing above 134 macro support, the uptrend structure from April–May lows remains intact.