Riot falling wedge, bullish breakout soonRIOT looking poised for a bullish breakout. Gap now closed, retesting wedge upper trend line, and a promising RSI divergence all hinting at an imminent rally.
Supporting evidence: Bitcoin closed out last month above $34,5K. RIOT, MARA and other mining stocks have yet to react in kind.
1RIOT trade ideas

Riot looking for another restest of 200SMARiot has been gaining steam but remains at a steep discount on the Bitcoin ratio. I entered calls around 8$ on the bounce and have held strong for the hopeful rally this week. RSI is picking up steam and looks to be assisting with the upward pressure nicely. Teal or green resistance needs to be taken next, my price target is still 13.8$ for coming weeks.

RIOT: will it make one last low or push up from hereEW structure is preferring one lower move to finish the ending diagonal wave C between $7-$8. However, BTC is not done with its move yet. The clue will lie on RIOT moves relative to BTC. If we see BTC making new highs in the next week or two but RIOT staying flat or not breaking highs then most likely the wave 5 down is coming. But it will be a screaming buy at those levels. I price breaks higher, then most likely the downside move is over, and every dip should be buyable in the medium term 2-3 months.

RIOT UP but sell the news on SEC ETF ReviewCrypto universe bid on prospect of SEC ruling pluss seasonality pluss fiscal funds still being allocated and breadth minus spectacular seven leaves rest of S&P 500 (S&P493 lol) P/E ratio at about 15 times and that is a long term fair value. $4,200 is critical level right below 200DMA held the other day and Santa clause rally pluss Israeli/Hamas war seems "contained" at this point as Israel pauses for humanitarian purposes after Biden embraces fellow president Netanyahu in spite democrat division on the subject in spite historically supportive. A change in geopolitics, a break of the $4200 S&P critical "Put-Wall" level, and/or a news headline on a ruling from SEC on the Crypto ETF are all "sell-the-news" events, to be looking out for.

Bull flag on riot longSmall bull flag forming on riot long, the riot to btc discount is still lagging by a lot.

RIOT IT'S view before bitcoin halving According to wave 🌊 theory we move to $20-35 , I don't where they wanted to end wave 5 , later correction to $9 below main zone $6
Later back to $35 above
According to Bitcoin if it start correction it's done 👍
RIOT reach $6 later rise to $35 above with in halving time
Any information u have anything u want just msg me privately

RIOTMID-TERM: Channel breakout, 200 SMA breakout, resistance breakout. (not financial advice)
cost averaging is important to note, already up a lot this week.

RIOT - long positionHello my fellow traders. Price of RIOT seems to break out the resistance in pre market. I am waiting for a retest of red line to get in LONG position. I am looking for retrace and bounce from support. On smaller time frame I will watch for a wick below and long after bullish close.

More zoomed in and more updates on riotA closeup with more resistance levels drawn on the call setup

Riot 12$ calls in decemberI havent had this much conviction in a trade in a while, riot remains heavily lagging BTC performance, longing here dec 1-15th 12$/14$ call spreads. RSI is reversing.

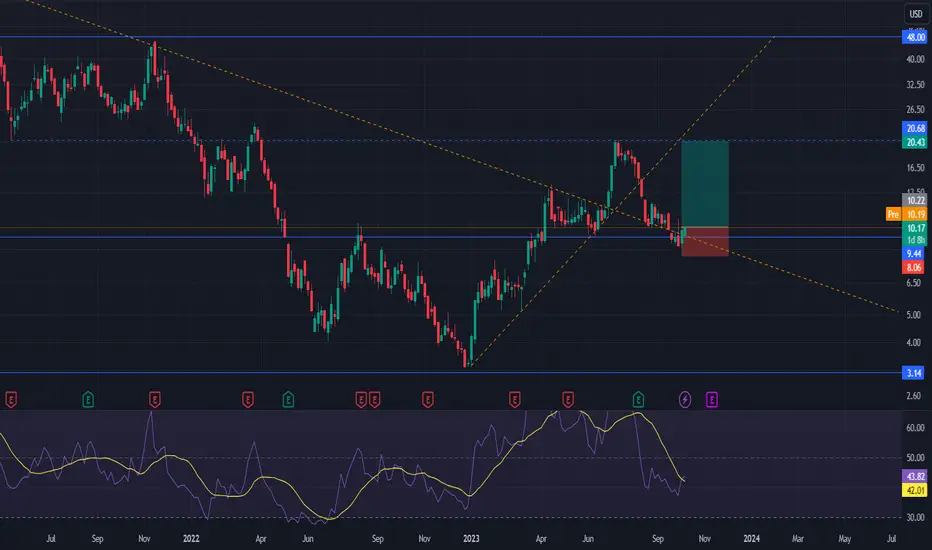
RIOT longHello traders. RIOT price broke the upwards trend line but it was still able to maintain higher highs and higher lows on HTF. Price is also testing descending trend line, which could lead to price increase and possible retest of higher resistance.
Target is 20.43 $ and stop loss 8.06 $.

Why RIOT and MARA are solid buys.Hey there traders just popping into share something i've been monitoring for around 2 years now.
This starts back at the C-19 Stock Market mania mixed with a little bit of BTC halving crypto craze.
When one day i was doing some research on how i can capitalize on the movements of crypto through the stock market via options or really just anyway i could get exposure because at that time i was in another country and i didn't have a valid US Drivers license but that's off the point.
Anyway me doing that made me discover NASDAQ:RIOT and NASDAQ:MARA and basically i started to trade those when i wanted to trade crypto without directly trading crypto if that makes any sense.
Anyway the price of RIOT and MARA went absolutely crazy during the climb to the ATH of BTC. Then naturally of course it came back down to simmer just as BTC is now, and the way i've been keeping tabs on Crypto while i've been out of the market is I had bought a share a while back on 1/12/2023, since then that one share has been up to 100%+ and is still currently now sitting around 67% gain.
The Meat and Potatoes
RIOT & MARA can print on options, or if you hold the shares from around now until the halving and a little after to really get the best of both worlds.
A little insight on what RIOT and MARA are and how they relate to BTC
NASDAQ:RIOT refers to Riot Blockchain, Inc. It's a company primarily involved in Bitcoin mining. Their objective is to expand their operations and thereby increase the number of Bitcoins they mine.
NASDAQ:MARA stands for Marathon Digital Holdings. Similar to Riot, Marathon is focused on Bitcoin mining. They aim to be one of the largest and most environmentally considerate Bitcoin miners in North America.
Both companies' stock prices tend to be influenced by the price and overall sentiment around Bitcoin because their core operations revolve around mining this cryptocurrency.
Thanks for reading. Tinfoil hat is off now

$RIOT Showing Bearish Signs, Trending to $6.22 - $7.21 Buy ZoneRiot Platforms (RIOT) had a strong rejection from the yellow resistance line in Q3, and closed with a bearish engulfing candle. RIOT has a high risk of trending downward for Q4, and has already started showing a lot of bearish signs. On the 3-day time frame the EMA ribbon is acting as an area of resistance. RIOT has dropped below the Ichimoku cloud of support, and RIOT has just lost support at the white trend line. I believe that RIOT will trend down towards the light blue support level over the next few weeks for a potential bounce there.

No Bitcon ETF? Bitcoin Miner RIOT is the next best thing.Note: All three indicators on this chart have turned positive Both moving averages and the Hi/Low Blocks.

$RIOTA falling wedge pattern here on the NASDAQ:RIOT breakout above $10.00. we can aim for the top of the falling wedge around $20 in the month of October and aim for $30 in the month of November. The same pattern for NASDAQ:MSTR NASDAQ:MARA NASDAQ:COIN $HUT.

Buy RIOT fakeout head and shouldersBuying Riot here after the circle fake break of the head and shoulders as shown.
Nice company to buy if you believe in crypto, well managed.
Expect a move back into the pattern and higher to try and break the wedge to the upside

Updated next resistance level on riotRiot is one of my long-term DCAs I recently switched from mara which I got very cheap during the cycle bottoms. 9$ is a steal for riot who has better fundamentals, 8.8$ is the next key area in my opinion for a bounce.

Cryptocurrency companies vs Bitcoin📉This graph shows the average price of the main companies in the cryptocurrency sector, and their correlation with Bitcoin.
⌛Waiting to see if a bear trap forms in the purple region, or if more declines are to come...

My view on Bitcoin miners remains bearishNew lows are on the way, this is not the first time it has had a large bear market rally...
Im looking for a shark to complete and will take a long around the support.
Not shorting unless we get a bounce, even though i would be bailed out eventually, I hate being in a weak position.

$RIOT - can it hold on to that support?NASDAQ:RIOT is sitting on a support. It's trading below the 200-day moving average now. If current support fails, it can drop to $7.77.
Breaking below highlighted basing area was a bit worrisome.
Looks like there is a small bullish divergence in MACD and RSI. The bullish divergence in MACD and RSI is a positive sign. This suggests that there is some buying pressure at the current level. However, it is too early to say whether this divergence will lead to a trend reversal.
Follow me for charts and technicals.

RIOT: coiling for something....RIOT is hanging around .618 retrace area on volume support, hugging POC of the range between $3 and $22. This should be a strong support. A breakdown right now might be an early warning of a big problem. If price grinds lower, I should expect support between $9 and $7.5. But will watch for a strong bounce before going in again. Right now there are bullish divergences in RSI up to Daily time frame, so should expect some kind of a bounce very soon.This moves with BTC, so, a pump in BTC price would certainly inflate RIOT. Still long in RIOT but getting very close to getting stopped out...

Riot denied the 9.5 dropRiot holding strong despite the temporary Bitcoin weakness and tech sell-off. Riot looking to continue to overtake NASDAQ:MARA because of their energy plan with texas. They have the ability to mine less bitcoin and provide electricity to the state as a revenue plan B.
