This goes hand in hand with my bitcoin ideaLooking for something similar to the prior channel in the last bear.
1RIOT trade ideas

Riot UOI TestTest of UOI indicator mixed with simple trendlines and own TA measures. Assuming trendline breaks, looking to see how accurate or long the sell signal reacts. 15 min time frame of course.

Long RIOT #tradingtheapocalypseFundamentals: Riot Platforms, Inc is a Bitcoin mining company that survived the recent downturn in Bitcoin price, unlike some of its competitors. That's as much as I need to know. This trade is a leveraged bet on Bitcoin. Bitcoin recently completed a weekly Wyckoff accumulation pattern, which was confirmed by the break and hold above 26k.
Technicals: Crypto equities seem to respect nothing in particular except the Bitcoin price, and the general stock market conditions. However, moving averages help. RIOT has closed above its 200-day Exponential Moving Average, and tested it as support, along with previous resistance, gapping up afterwards, showing demand.
The trade is a long from here, with a stop below the recent low around $5. Ultimate target is the most recent peak the last time price was above the 200 EMA, but really the trade should be managed according to the state of the crypto market.


RIOT - 126-130$ top target for 2025In this analysis, we will delve into the significance of confluence in technical analysis, the implications of shareholder dilution, the role of Bitcoin mining, and the importance of the technical indicators used in our assessment of Riot Platforms, Inc (RIOT).
Confluence in Technical Analysis
Confluence is a crucial aspect of technical analysis, as it allows traders to identify critical price levels where multiple technical indicators align. This increases the probability of a successful trade, as it provides confirmation and reduces the likelihood of false signals. The confluence between the 1.382 Fibonacci speed resistance fan and the horizontal 1.618 Fibonacci extension level in RIOT's chart offers a compelling indication of a potential turning point.
Shareholder Dilution
Shareholder dilution occurs when a company issues additional shares, which results in a decrease in the ownership percentage of existing shareholders. This can negatively impact the stock's value and investor sentiment. Therefore, avoiding shareholder dilution is essential to maintain shareholder confidence and support the stock's price appreciation.
Bitcoin Mining
As a company primarily engaged in Bitcoin mining, RIOT's performance is closely linked to the cryptocurrency market. Continued growth in Bitcoin mining will likely support RIOT's revenue and contribute to its stock performance, especially during periods of heightened crypto market activity. Conversely, regulatory setbacks or a decline in mining activity could negatively impact RIOT's stock price.
Technical Indicators
Our analysis employs the convergence of the 1.382 Fibonacci speed resistance fan and the horizontal 1.618 Fibonacci extension level to determine potential price targets. These indicators have proven to be reliable in identifying key support and resistance levels in the past. By extrapolating the data from these indicators, we can project a potential price target of $126-$130 for RIOT.
Conclusion
In light of the confluence observed in RIOT's chart and the importance of avoiding shareholder dilution and sustaining Bitcoin mining operations, we recommend considering a long position in RIOT around November/December of this year. This strategy aims to capitalize on the anticipated cryptocurrency market euphoria and achieve a price target of $126-$130. However, it is crucial to monitor the company's performance and the regulatory landscape, as these factors may impact the stock's trajectory.

$RIOT Monthly high in play!$RIOT such a great day! Looks like we found acceptance over this 2 month range..size pushes $RIOT over Tuesday’s high look for $7.50+.
*50MA&200MA possible golden cross in play.
As always manage risk accordingly.

Preparing for a move. $RIOT as long as it is able to remain above Monday’s high acceptance over the balance zone can lead to price looking to take out some upper stops. Interested in this as we see some strength in BTC carrying over to the miners..
*50MA&200MA possible golden cross on the daily.
As always- stays safe and manage risk accordingly.

RIOT - Quiet on the Home FrontLooks can be deceiving and they can also be pleasing to the eye... this one is eye catching atm... just not sure if I'm believing what I'm seeing... a 5 wave ride is always followed by another, so if this is a valid count, we should soon see the tide if it hasn't already rolled in. The square box will be of utmost interest as it should offer an indication of which path this looker will prefer to take... lose the highlighted square and the gap at 4.30 should get attention and offer support... climb out of that square, and the Quiet RIOT will start making you feel the noize and dance to the beat of the bulls. The intensity and structure of this next 5 wave move should offer intentions of the following waves. Candles suggest a short term bottom as long as 5.51 holds on a daily close. GLTA!

$RIOT: Weekly reversal signal...It seems Bitcoin miners are reversing their wave of misfortune here...Nice setup to go long with low risk here.
Best of luck!
Cheers,
Ivan Labrie.

Following the Crypto TrendDepending on how it all plays out with bitcoin we could see history repeat itself in a big way shortly. aligning with the macro theory that 2026 will be profitable for a majority of traaders, giving the global 2-3 years to get used to higher interest rates markets should settly and head towards new highs as long as nothing too unpredictable happens. following that narative all of these btc mining companies, as long as their in line with developmental goals, should reap the rewards. just spitballing here nothing too serious
RIOT - Buckle UpRIOT is about to take off - which direction is not entirely clear atm, but IMO up is the way. BBs are getting tight and horizontal and there has been a bunch of price action at this region... GLTA!

RIOT Blockchain vs CoinbaseSimple comparison of RIOT Blockchain to Coinbase. Both will do well but it does matter what which one you are holding at certain times of the cycle.

RIOT - Adam and Eve pattern in the making?RIOT appears to be forming an Adam and Eve pattern (8 months in the making now) with the stock flirting with the 200 day moving average since 30 Jan this year.
What is worth noting was its volume pattern since the start of this year: higher volume up days (accumulation) vs lower volume down days (distributions). A tell tale sign that the stock is probably on investors' radar rather than shortists' at current prices.
While it is tempting to long the stock at current levels, there is still risk that the stock could continue to trade sideways for a (long) while more. I would probably wait for a break above 7.78 (neckline 1) to initiate some long positions. Even so, be mindful of headwinds @ 8.67 (neckline 2) and then @ 10.52 (neckline 3).
However, should the stock be able to clear above 10.52 eventually, then it is a stronger signal that uptrend is underway (volatility not withstanding).
p/s buy the dips is also a good strategy once an uptrend is established.
Disclaimer: Just my 2 cents and not a trade advice. Kindly do your own due diligence and trade according to your own risk tolerance and don't forget that money management is important! Take care and Good Luck!

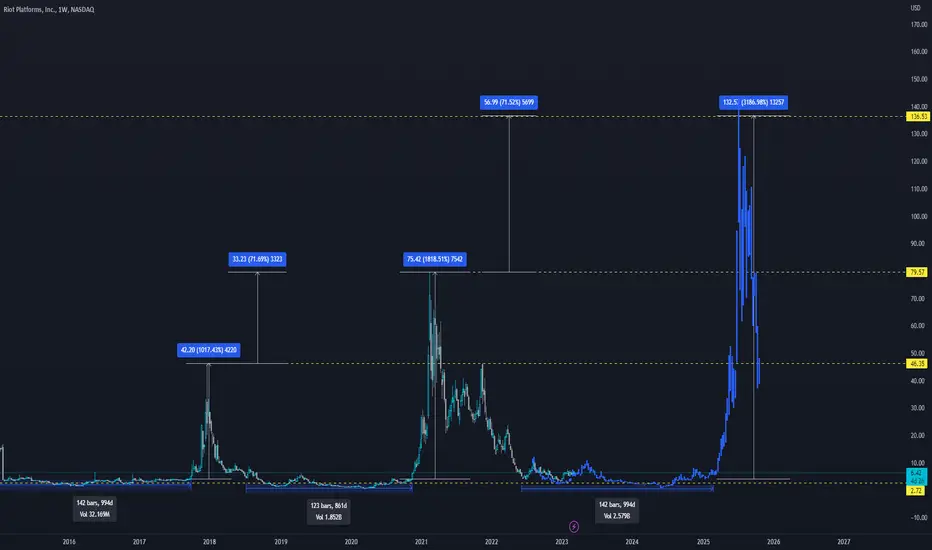
Riot looking great right now, anticipated high of $80 ++Riot looking great right now, anticipated high of $80 ++, now it is at 6.59 as i write this review, the Fibonacci circles are indicating a high of at least 80 in the next bitcoin run. Next level would be 337 for riot if Bitcoin goes to the higher levels of $200,000 to 418,000. This update is for entertainment purposes, should you require financial advise, seek out a professional. Thanks.

RIOT - Quarterly Outlook - For the DreamerZZZJust candles for simplicity... Still needs to close March (and the quarter) with a bullish posture (ideally a bullish engulfing) - if it does, then this become more probable... currently for the dreamerzzz, but has the look atm... I get a clean 5 waves off the lows... GLTA!

small retracement then we head towards 10small retracement to about 6.77- current price then we rally towards 8.50, after a small retracement from there we should see $10 as our next major level within a week or so


Invers HSI believe if BTC rise, Riot will rise as well. As you can see on the chart that the right shoulder is forming at the moment.
TP1:10.50
TP2: 17.30
Obviously its only my idea, not financial advise.

RIOT at extreme support, move higher expected🤖I expect to see the 3rd big bounce from this support zone in the near future, potential for 1000%+ in returns is possible! it may take a while though.
stop loss below supports and targeting 24.01-40.97-54.70


lets get a RIOT goinglets get a RIOT going - I see $8.22 very soon once we get past this comical "fake" double top ;)


RIOT Blockchain: Bearish Divergence Double TopRIOT has Hidden Bearish Divergence ont e MACD and Classic Bearish Divergence on the RSI and I will be playing this via the March Puts at the strike of $5.5.
