Riot possible targets Crypto seems to be recovering. I’m looking for this to move this week. Looking for a $33 or $37 target this week.
1RIOT trade ideas

RIOTRIOT breaking out of a channel from the past quarter and now testing a key level inside intraday wedge & deviation channel into the close.

RIOT_BUY Plenty of BUY signals for this stock that has a really great spread and could make ti to 50$ before a pullback...

Bullish CypherI see conflicting dates on when the Earning announcement is due. ON here it says today. On Earnings Whisper is says the 16th of this month AMC. Some sites say not confirmed.
Riot is moving and has just about met targets 1.
Cypher is recognizable by peak 2 being higher than peak 1. The last leg should land close to the 0.786 of XC. Possible stop under D or last pivot low.
No recommendation

$RIOT Target 45.70 for 51.27% $RIOT Target 45.70 for 51.27%
Or next add at 30.47
We've gotta push through the resistance here... Let's go...
I did not add here...
-----
—
On the far right of the chart is my Average (Grey) Current Target (Green), and Next Level to add (Red) Percentage to target is from my average.
ONLY ADD at support levels & FIB levels… labeled
I start every position with .5 - 1% of my account and build from there as needed and as possible.
I am not your financial advisor. Watch my setups first before you jump in… My trade set ups work very well and they are for my personal reference and if you decide to trade them you do so at your own risk. I will gladly answer questions to the best of my knowledge but ultimately the risk is on you. I will update targets as needed.
GL and happy trading.

Bump-and Run Reversal BottomThe bump-and-run reversal bottom is a chart pattern that is a surprisingly good performer in both bull and bear markets (ranking second best). It has a low break even failure rate and high average rise after the breakout. Discovered by Thomas Bulkowski in 1999.

RIOT breaking out of consolidation zoneRIOT looks primed for a move to the high $30's-low $40's this week.
RIOT. blockchain stock. should catch up with bitcoin soon.might be good for a short/mid term opportunity. If it does well then just hold it as long as crypto continues higher.

RiotWatching riot. If we confirm a daily close above 3483 we could b setting up. Otherwise pur trading Chanel is from 30.87-34.60ish. I’m waiting for a close and confirmation above that area before I go long

After Big Push Up and Earnings Inflation, Time to Sell RIOT?In institutionalized markets, we often see patterns of up and down, up and down, verses more free markets, in which we see large bull trends followed by disastrous bear trends for some. The more popular the asset, the more swings we often see, as people play a tug of war to win Bull or Bear.
As you can see in this long-term Daily Chart, RIOT has had two weeks of a solid uptrend, followed by slight sell-off, and consolidation near the top. The bottom lies around the golden figure of $22 USD.
In the shorter-term to medium-term charts, I see little room to move up on the top, with Bitcoin once again reaching resistance at $41,000, and massive downside potential. For the monthly chart, we are at a monthly high. Warren Buffet would recommend to sell the overbought monthly high for a weekly profit.
Technical indicators show we are overbought, and due for a slight-to-moderate correction. For the yearly, we are still in a downtrend for both RIOT and BTC, with highs far, far away.
The push up in RIOT is likely due to its earnings coming out in two days. Days before earnings arrive, the stock anticipates positive or negative earnings, and rises unexpectedly. Most of the price action commonly occurs before, not after earnings come out.
Don't buy the hype. Markets feel ebullient, with SPY at all time highs, making a 38% gain in 1 year, but much of the country is truthfully in a depression. Banks just lowered interest rates again, making savings accounts useless. Many other modern countries having savings with a rate of 8%, more than the typical gain per stock market year. US will have a harder and harder time existing on trillions of debt and even Bitcoin and cryptocurrencies can't save the monster of debt US is lugging around behind its warguns.
For myself, I'd rather sell resistance, and buy major support.
Ask yourself, too: what is a bit of coin? What is a bit of money to you? A bit of coin to Bank of America is $10 for quarters. That is the maximum amount of coin they will give you.
Now think about a billionaire's motive: what is a bit of coin to him? This man has never had to live paycheck to paycheck, does not know the real value of money. To a billionaire, a bit of coin is $100,000. To a multi-millionaire, they often spend $50,000/month on housing and other expenses. At least, that's what I've seen with my own eyes, with real people millionaires.
If Bitcoin continues to go up, its ultimate DARK SIDE comes out. It will have the capacity to inflate all assets. In my city, food prices have doubled in many restaurants since BTC reached 60k. Apartment prices have gone up at least 10%. Many people want higher Bitcoin, but it may destroy USA. USA is known for little inflation and fair prices to be united. You have to be a citizen first, and Gordon Gecko of greed second.
Reminder: Always do your own analysis.


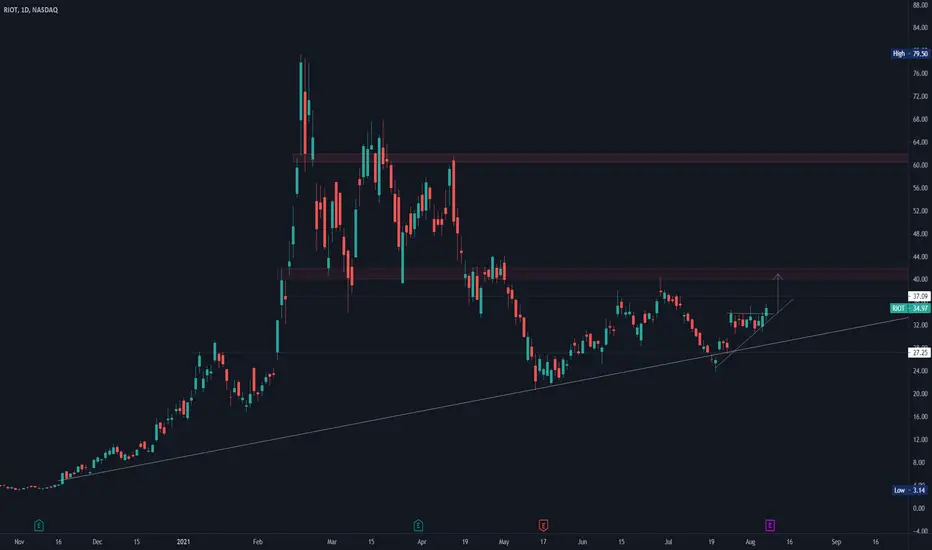
Riot Blockchain Breaks the 50-day SMABitcoin miner Riot Blockchain has been skidding lower since February, but now it could be ready to move again.
The main feature on its chart is its jump above the 50-day simple moving average (SMA) on July 26. It’s formed a tight consolidation pattern above the line since. The current action differs from a moment like early July, when it failed to hold above that line.
Next, RIOT’s 8-day exponential moving average (EMA) just crossed above the 21-day EMA.
Third, prices recently tested and held the 200-day SMA.
The other question for RIOT is obviously your outlook for Bitcoin, which just had its biggest two-week gain since March. It’s now making higher lows as it consolidates around $40,000. If prices continue higher from here, RIOT could break its five-month downtrend and head back toward their 2021 highs.
TradeStation is a pioneer in the trading industry, providing access to stocks, options, futures and cryptocurrencies. See our Overview for more.

Riot ideaWithout the inclusion of btc interference $Riot is possibly in a wxy pattern depending on if it stays below the fib on the possibly forming triangle this should come down to the 0.5 fib on the macro scale but it will take time but depends on it keeping the rejection at the 0.618 on the micro if not it could form just a lil higher zig zag abc and then head down and possibly forming an bearish expanding flat but could also just form another zig zag down but I put it cause I know riot is pretty volatile
As always good luck trading ; )

RIOT - Bullish flag pattern on 4 hrBullish flag pattern on 4 hr chart. With BTC and ETH up 1 -2 % over the weekend, look for Crypto stocks to get a little pump on monday. Open interest for Aug 20 expiry - 3100 $35 Aug 20 calls, 4600 $40 calls. MARA MSTR BTBT are other bitcoin related names to watch.

Pull Back Fishing Former ARCRIOT appears to have been a parabolic arc before it's descent back to earth.
Riot broke to the downside from a symmetrical triangle up near the top.
Most parabolic arcs fall at least to the .5 fib level, but the 62-79% is the average fall. It depends on the security. Some can fall further. Often they fall somewhere in between the .618 and the .786
No recommendation.
Negative volume has dropped but was high at the bottom at the 23 to 28 range.
When there is nothing to do, it is sometimes best to do nothing

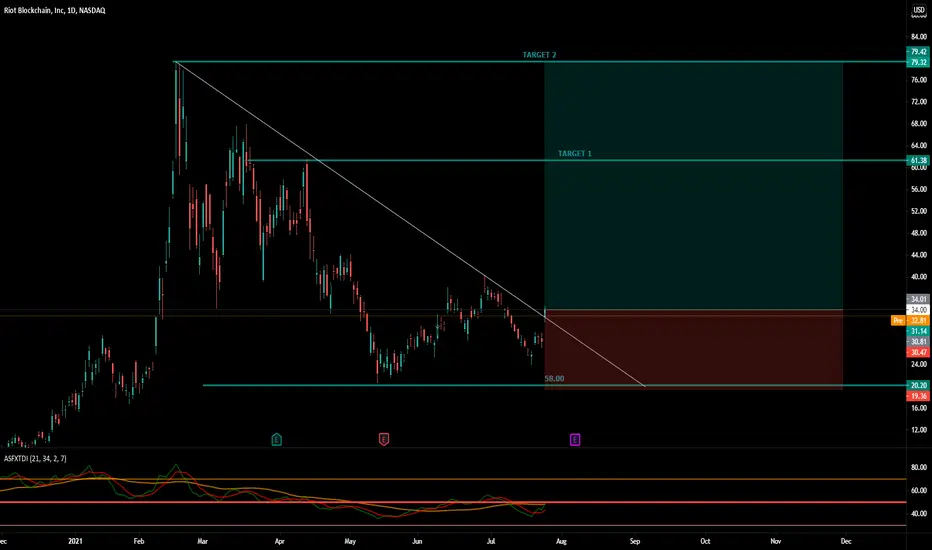
RIOT - SELL below 30.50 Target $19We continue to SELL RIOT, pressing positions from $40.56
August will be a Difficult Month for RIOT.


RIOT massive breakoutRIOT just broke out on the daily from this massive triangle.
If BTC keeps on pushing higher we might see RIOT making a run to the upside
RIOT_BUYsigRIOT and cryptos getting some good news and this fib could get some momo soon but needs some more bullish momo...

Capitulation is imminent (Not Financial Advice)
30 Billion dollar pension fund has just increased its holdings in BTC miners and Riot Blockchain is one of the lucky two.
In a first for the state of New Jersey this is just one move that is proving there is still more to come in this bull cycle. What the effects of this latest investment is, is yet to be seen but this shows a bright future for both Riot and BTC.

Trading Triangles and ChannelsGreat trading day, loved the quick action on the charts.
Today, RIOT formed a symmetrical triangle in the morning hours.
I marked the top resistance levels, mid support/resistance levels, and bottom support levels.
It was a fantastic freefall from the top resistance levels to mid support levels, where it then formed resistance and plummeted to bottom support levels.
Trade #1 - Up $800 USD in Paper Account
Trade #2: Up $350
Trade #2 was based on Descending Wedge and Channel patterns, forming new support and resistance levels.
It's very hard to see on the 15 minute chart, as I was working with smaller time levels that I cannot publish about.
How do you manage risk? Share any risk-management tactics, traders!

Riot_60fibRIOT maybe on the way up but still has some bearish momentum from its recent highs but the spread is a beast and should be put on the watch list...possibly a good entry for the stock when the DMI gets a little more bullish...Neutral but the upside could be 20% or higher...

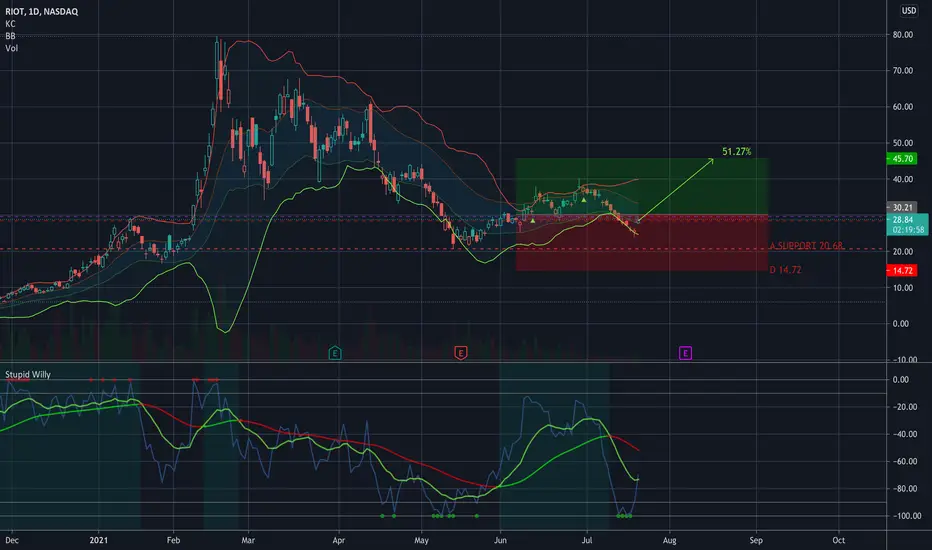
Added to $RIOT New Target 45.70 for 51.27% 🟢 $RIOT Target 45.70 for 51.27%
Added here @ minor support in hopes of a good crypto run...
-----
—
On the far right of the chart is my Average (Grey) Current Target (Green), and Next Level to add (Red) Percentage to target is from my average.
Numbers with an A are places that are a good idea to add if you can.
Numbers with a D are places where you should double your position.
I start every position with .5 - 1% of my account and build from there as needed and as possible.
I am not your financial advisor. Watch my setups first before you jump in… My trade set ups work very well and they are for my personal reference and if you decide to trade them you do so at your own risk. I will gladly answer questions to the best of my knowledge but ultimately the risk is on you. I will update targets as needed.
GL and happy trading.