SMCI CRACK!!I called the absolute top in SMCI back on April 4th, 2024. see chart below. This year I am once again calling a CRACK!! lower. No, it is not seasonal it is just happenstance. )) This is a very simple trade as most of my trades are. Bulls take your money and GO!! Shortby RealMacro7
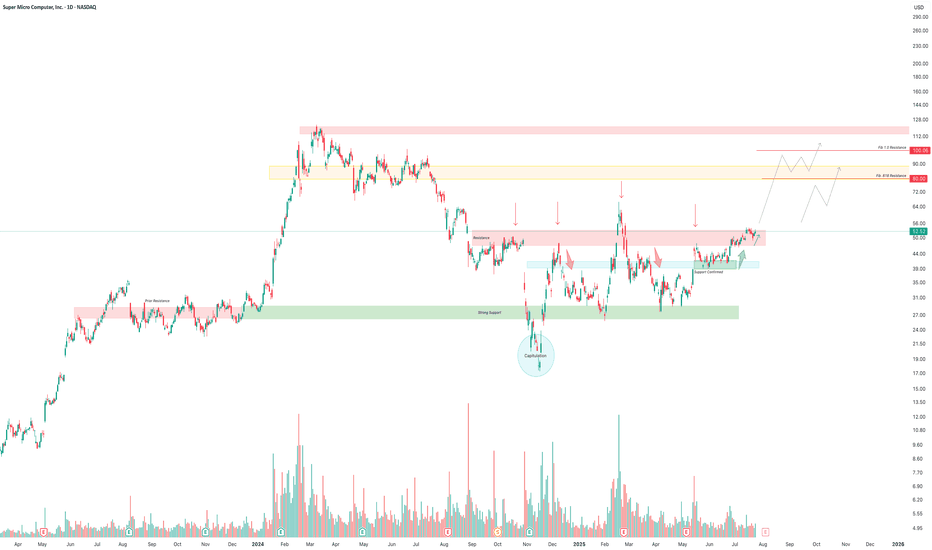
SMCI is a bargain here. Target $90.Super Micro Computer Inc / SMCI is trading inside a Channel Up. The new bearish wave has already completed a -47% decline, same as the previous one, and the symmetry inside this pattern seems very high. The price is now very close to the Channel's bottom and is technically a strong buy opportunity. We expect a new higher high close to the 1.618 Fibonacci extension. Buy and target $90. Follow us, like the idea and leave a comment below!!Longby TheCryptagon2240
SMCI: Enormous buy opportunity for a $70 Target.Super Micro Computer went from oversold to almost neutral on its 1D technical outlook (RSI = 42.789, MACD = -2.030, ADX = 39.343) as it is having an enormour turnaround on the 1W MA200 and the bottom of the Channel Up today. This is so far the biggest 1D green candle since January 19th 2024. The 1D RSI is on the same rebound as the February 3rd bottom was, so at least a +158.65% bullish wave is to be expected. Go long, TP = 70.00. ## If you like our free content follow our profile to get more daily ideas. ## ## Comments and likes are greatly appreciated. ##Longby InvestingScope7
SMCI Trade Recap📈Getting ready to start a new swing trade on SMCI, and I’ve mapped out my game plan with a tiered entry strategy and clear profit targets. Here’s how I’m setting it up: Entry Levels (Scaling In): $40.50 – First buy if it pulls back to this area. Looks like solid support, and I’ll test the waters here. $35.80 – Adding more if it dips further. This level has acted as a strong bounce zone in the past. $30.60 – Final entry if it gets down here. Oversold territory + psychological level = great risk/reward. Profit Targets (Scaling Out): $47.00 – First target to take some profits off the table. $51.60 – Second target — likely to see some resistance here. $60+ – Stretch target. If the momentum is strong, I’ll hold a portion with a trailing stop and let it ride. Game Plan: I’m staying patient with entries, letting price come to me. The idea is to build the position gradually and reduce risk by scaling in. I’ll also be keeping an eye on volume and broader market sentiment — if the setup changes, I’ll adapt. Let’s see how it plays out — risk-managed, calm mindset, and ready to pivot if needed. 🚀Longby Robert_V12Updated 23
How far will it eventually fall SMCI?During such a general crisis, things are very complicated for all stocks and everything depends. The fundamentals are key here and any decision by Trump can change things in a second and that is why we say how far, not how far will it fall. Given the possible further decline of the SP500 to around $5360-5400 and based on the 4-hour chart, it is clearly seen that the dynamic support line from the accumulated volume lies at around $29.5 and $30.5. The reversal signals are clear (the green triangles below). Therefore, it is very unlikely that we will see a drop below $30 . This is a very good entry point, but I do not advise anyone to trade until April 2, although I think things will become clear later today or tomorrow.Longby kometata11
Super Micro Trade IdeaA risky trade, but with great risk comes great reward. We are at the trendline touching for the third time, and we have pivot off it in the pre market. A company who has demonstrated strong growth potential and the AI bubble starting to come together this will be a stock I will hold onto for sometime. Longby Capitalist_Zach13
Continue a little further down, but the main course sits at 40Still room to decline, furthermore, the resistance wall sits on top of the triangular method (A, Band C; rise, down to 30 (the more significant retrace) before concluding the phase as a reset/consolidationby themoneyman809
Bullish Reversal Setup SMCI!📊 Falling Wedge Breakout Forming 🚀 SMCI is showing signs of a bullish reversal after a strong downtrend. Price is consolidating inside a falling wedge pattern and now testing support near $36.55. This setup offers a high reward-to-risk opportunity for an upside breakout. ✅ Trade Plan (Long Position) • Entry: Above $37.05 (wedge breakout confirmation) • Stop-Loss: Below $35.44 (structure support + wedge base) 🎯 Take Profit Targets: • TP1: $39.82 (key resistance zone) • TP2: $43.32 (major recovery level) • TP3: $44.00+ (extended upside zone) 📈 Risk-Reward Breakdown • Risk: $37.05 - $35.44 = $1.61 • Reward to TP1: $2.77 → ~1:1.7 • Reward to TP2: $6.27 → ~1:3.9 • Reward to TP3: $6.95 → ~1:4.3 💡 Strong potential with price bouncing near demand + wedge breakout. 🔍 Technical Analysis ✅ Falling Wedge Pattern: Classic bullish reversal setup ✅ Support Zone: Horizontal and diagonal support at $36.55 ✅ Volume Check: Monitoring for spike as confirmation ✅ Price Action: Buyer reaction visible near lower trendline 🧠 Strategy & Risk Management • Wait for a 30-min candle close above $37.05 to confirm breakout • Move SL to breakeven after hitting TP1 at $39.82 • Take 50% profit at TP1, ride remaining position toward TP2 & TP3 • Protect gains with a trailing stop on higher timeframe 📚 Value for Traders: This setup is a great example of how falling wedges often signal trend exhaustion. Combined with support and declining volume, it suggests a shift in momentum. Breakouts from such structures can be explosive when confirmed with price and volume. ⚠️ Risk Factors ❌ Weak breakout without volume ❌ Breakdown below $35.44 invalidates the setup ✅ Focus on execution and not prediction 🎯 Final Thoughts High-probability long opportunity on a quality setup. Follow the plan. Stick to the levels. Let the chart lead the way. 📈 🔗 #SMCI #StockSetup #ProfittoPath #BreakoutStrategy #ChartAnalysis #TradingView #SmartTrading #BullishReversal #FallingWedge 💰📊 Longby ProfittoPath11
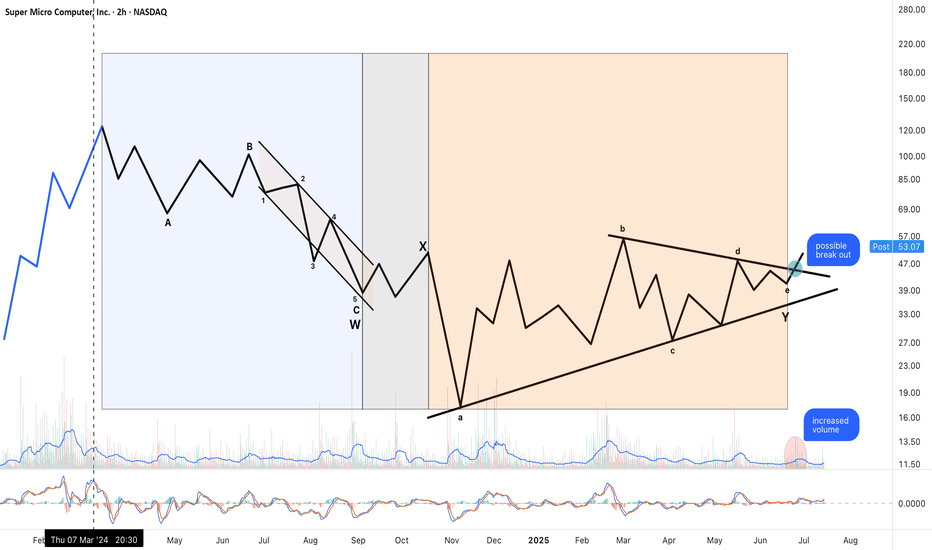
SMCI Wants to Go HIGHERIn recent developments, Super Micro has experienced significant stock volatility. After filing delayed financial reports to regain Nasdaq compliance, the stock initially surged but faced declines due to broader market factors and investor concerns. Analysts have mixed views: Mizuho Securities assigned a neutral rating with a $50 price target, citing competition in the AI server market, while Goldman Sachs highlighted both opportunities in AI demand and risks like increased competition and margin pressures. I am tracking this using Elliott wave theory. I will update periodically. The white line is my current cost basis. Longby BigeMarketUpdated 1112
I'm shorting thisTwo weekly timeframe for a better understanding. Looks like a large bearish flag forming. Price just bounce off the bottom of the flag. But I think is a dead cat bounce. Is hitting a resistance level 35-36. Doesn't look too sting to break it up. SL triggers if a weekly candle breaks up the resistance and closes above it. Shortby ArturoL0
Opening (IRA): SMCI April 17th 34 Covered Call... for a 32.13 debit. Comments: High IVR/IV. Selling the -84 delta call against shares to emulate the delta metrics of a 2 x expected move 16 delta short put, but with the built-in defense of the short call. Metrics: Buying Power Effect/Break Even: 32.13/share Max Profit: 1.87 ROC at Max: 5.82% 50% Max: .94 ROC at 50% Max: 2.91% Will generally look to take profit at 50% max, roll out short call if take profit is not hit.Longby NaughtyPinesUpdated 3
SMCI pampThe company provides its products to enterprise data centers, cloud computing, artificial intelligence, 5G, and edge computing markets. It sells its products through direct and indirect sales force, distributors, value-added resellers, system integrators, and original equipment manufacturers.Longby space_bear14
SMCI: Channel Up bottomed on the 1D MA50. Long term Target: $148Super Micro Computer Inc is neutral on its 1D technical outlook (RSI = 52.184, MACD = 0.800, ADX = 28.146), the ideal condition to go on a long term buy as the price has been holding the 1D MA50 for 2 straight weeks. The goal now is to cross again above the 1D MA200 but that was already done on February 18th and the pattern that has been established is a Channel Up. The market however may be aiming at much higher as the November 14th 2024 bottom was priced on the Head of an Inverted Head and Shoulders pattern, a technical bullish reversal formation that targets its 2.0 Fibonacci extension once completed. The trade is long, TP = 148.00. ## If you like our free content follow our profile to get more daily ideas. ## ## Comments and likes are greatly appreciated. ##Longby InvestingScope28
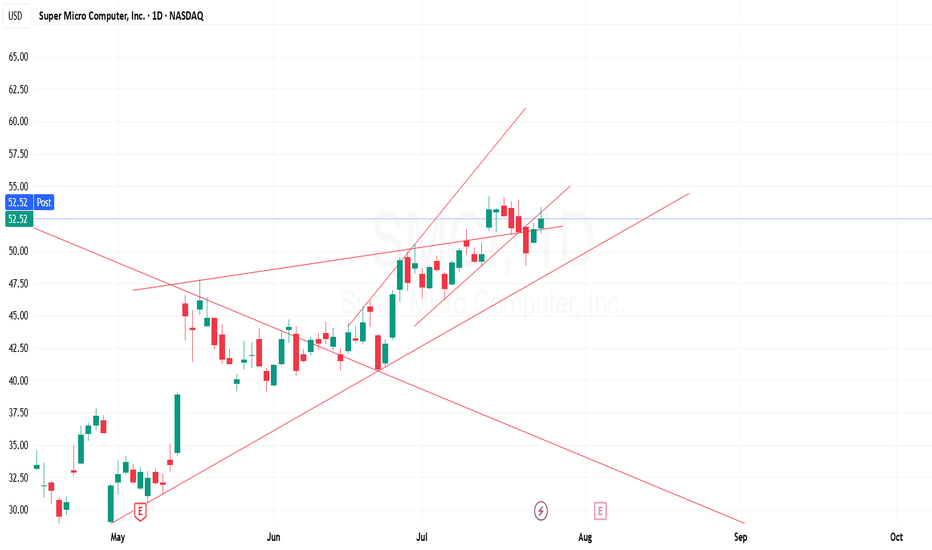
SMCI Pennant Breakout?SMCI pulled way back from its high last month and has been forming what looks like a pennant/wedge. Is it breaking out to the upside now?by scottammons13
SMCI -- more weakness ahead near term!looking for additional sell sequences to fill gap targets at 33.7 and 31.5 levels as we approach tariffs being implemented on 4/2/25. holding put options for 4/17 expiration Shortby DaveTradesLive221
A Quintillion Reasons to Invest: N^18 SMCI + NVDAA Quintillion Reasons to Invest: SMCI and NVIDIA Propel Walmart and Global Industries to Trillions March 20, 2025 In the realm of investing, capital allocation reigns supreme—a disciplined endeavor to direct resources toward opportunities that maximize returns while minimizing systemic risk. In today’s data-driven global economy, Supermicro (SMCI) and NVIDIA (NVDA) have emerged as the vanguard of computational supremacy, delivering a transformative edge through their latest technological innovations. Their GB300 NVL72 systems, paired with NVIDIA’s Blackwell Ultra GPUs, harness the power of N^18 computation—one quintillion operations per second—a feat unattainable just one week prior. This seismic shift, a $10 billion investment in hardware, redefines what industries can achieve, unlocking trillion-dollar opportunities across sectors and geographies. Consider Walmart as a case study in this revolution. By deploying $500 million in SMCI and NVIDIA technology, Walmart can predict consumption patterns with unparalleled precision. Imagine a 15% spike in grill sales when temperatures reach 75°F—Walmart, armed with this foresight, negotiates industrial capacity at 20% lower rates, widens profit margins by 3 percentage points, and captures an additional $2.5 billion in annual profits. This predictive power allows Walmart to secure aluminum futures at $2,500 per ton during a 90°F heatwave, producing 10 million soda cans preemptively and seizing $50 million in sales before competitors can react. Without this technological edge, Walmart would be left scrambling, ceding market share to rivals who act faster. The numbers are stark: a modest $500 million investment yields billions in returns, a testament to the power of computational foresight. This advantage scales globally with staggering implications. If 50,000 retailers worldwide adopt this $25 billion technology, each could realize $50 million in annual profit gains, culminating in an aggregate of $2.5 trillion. Supply chains across the globe arbitrage this predictive capability, turning data into cash. For instance, anticipating a surge in yoga gear demand post-New Year’s, retailers can flood warehouses ahead of time, capturing market share and boosting margins while competitors lag. This isn’t mere speculation; it’s a calculated strategy rooted in the unprecedented computational might of SMCI and NVIDIA. Without their systems, industries remain tethered to petascale limitations—10^15 operations per second—incapable of processing the trillion-parameter models that modern AI demands. Legacy systems falter, unable to match the data velocity and volume required for market dominance. The implications of N^18 computation extend far beyond retail, shattering barriers that confined industries just days ago. A week prior, trillion-parameter models overwhelmed even the most robust systems, stalling at petascale thresholds and requiring weeks to process. Now, SMCI and NVIDIA’s N^18 capacity completes these tasks in hours, delivering real-time insights that redefine operational efficiency. Financial institutions, for example, can now model quadrillion-variable risk scenarios, identifying potential missteps and saving $1 billion annually in losses. Governments leverage this power to optimize traffic grids across 1,000 cities, reducing commute times by 15% and saving $500 million in fuel costs each year. These feats were pipe dreams last week, as systems buckled under the sheer deluge of data. Today, they are reality, driven by the $10 billion hardware investment in SMCI and NVIDIA technology—a catalyst for trillion-dollar value creation. This computational revolution is not a race of abstract metaphors but a winner-takes-all contest defining our era. SMCI and NVIDIA are the architects of this new paradigm, their synergy transcending mere assembly. NVIDIA’s Blackwell Ultra GPUs, wielding quintillions of calculations per second, provide the raw horsepower, while SMCI’s advanced server and rack architecture integrates this power into a cohesive, exascale-capable system. Together, they form a technical triumph, enabling industries to surpass petascale bottlenecks and pioneer an AI-driven future. Their partnership is the backbone of progress, from autonomous vehicle fleets to real-time financial forecasting. For instance, Visa can now mine trillions of transactions to predict a surge in energy drink purchases by teens at 80°F, dispatching timely incentives and steering commerce, while preemptively optimizing supply chains for the next demand wave. Legacy systems, noting only “coffee on Mondays,” cannot compete with this granularity. The stakes are unequivocal: align with SMCI and NVIDIA, or risk irrelevance. Shorting these titans is folly—only the boldest speculators dare, and history shows their fate: capitulation, fueling monumental returns for those who invest wisely. The numbers speak volumes: a $10 billion investment in SMCI and NVIDIA hardware unlocks trillions in value, from supply chain foresight to policy efficiency. This advantage permeates every sector—logistics and operations management globally reap billions in savings, while governments enhance efficiency, saving billions in public expenditure. The first movers triumph, as seen in the financial sector: should Visa adopt this technology before Amex, Amex becomes the short, Visa the long, and vice versa. This dynamic extends beyond retail and finance, touching all competing interests solving equations with exponentially more variables. Investors, the directive is clear: capital must flow to those addressing existential needs. SMCI and NVIDIA are not optional; they are the drivetrain of a scalable tomorrow. Their combined infrastructure, with 72 Blackwell GPUs, 36 Grace CPUs, and NVLink precision, forms a singular intellect in a liquid-cooled rack, eclipsing petascale relics that once drained power across vast footprints. This technology pioneers AI’s frontier—self-driving cars, adaptive robotics, even self-authored films—unlocking trillion-dollar prospects. Allocate resources to this power, or watch others claim the windfall. Capital allocation demands no less.Longby imcnf5c4ff115
Potential Bearish Flag in Super MicroSuper Micro Computer has bounced since November, but some traders may expect further downside. The first pattern on today’s chart is the major slide that began last May. SMCI’s spike in February stalled at a 50 percent retracement of that move. The maker of AI servers also tried and failed to clear its 200-day simple moving average (SMA). Those signals may confirm the longer-term trend is moving lower. Next, the small rising channel so far in March could be viewed as a bearish flag. Third, SMCI has tried to hold support at its 50-day SMA but yesterday closed under it. Fourth, the 8-day exponential moving average (EMA) has remained below the 21-day EMA. MACD is falling as well. Both of those patterns may reflect short-term bearish trends. Finally, SMCI is one of the most active underliers in the options market. (TradeStation data shows it averaging more than 800,000 contracts per day in the last month.) That could help traders position for moves with calls and puts. TradeStation has, for decades, advanced the trading industry, providing access to stocks, options and futures. If you're born to trade, we could be for you. See our Overview for more. Past performance, whether actual or indicated by historical tests of strategies, is no guarantee of future performance or success. There is a possibility that you may sustain a loss equal to or greater than your entire investment regardless of which asset class you trade (equities, options or futures); therefore, you should not invest or risk money that you cannot afford to lose. Online trading is not suitable for all investors. View the document titled Characteristics and Risks of Standardized Options at www.TradeStation.com . Before trading any asset class, customers must read the relevant risk disclosure statements on www.TradeStation.com . System access and trade placement and execution may be delayed or fail due to market volatility and volume, quote delays, system and software errors, Internet traffic, outages and other factors. Securities and futures trading is offered to self-directed customers by TradeStation Securities, Inc., a broker-dealer registered with the Securities and Exchange Commission and a futures commission merchant licensed with the Commodity Futures Trading Commission). TradeStation Securities is a member of the Financial Industry Regulatory Authority, the National Futures Association, and a number of exchanges. Options trading is not suitable for all investors. Your TradeStation Securities’ account application to trade options will be considered and approved or disapproved based on all relevant factors, including your trading experience. See www.TradeStation.com . Visit www.TradeStation.com for full details on the costs and fees associated with options. Margin trading involves risks, and it is important that you fully understand those risks before trading on margin. The Margin Disclosure Statement outlines many of those risks, including that you can lose more funds than you deposit in your margin account; your brokerage firm can force the sale of securities in your account; your brokerage firm can sell your securities without contacting you; and you are not entitled to an extension of time on a margin call. Review the Margin Disclosure Statement at www.TradeStation.com . TradeStation Securities, Inc. and TradeStation Technologies, Inc. are each wholly owned subsidiaries of TradeStation Group, Inc., both operating, and providing products and services, under the TradeStation brand and trademark. When applying for, or purchasing, accounts, subscriptions, products and services, it is important that you know which company you will be dealing with. Visit www.TradeStation.com for further important information explaining what this means.by TradeStation14
SMCI FOMO for longs, pure terror for shorts—ALERT!!!SMCI SuperMicro Alert !!! sooo Urgent - don't miss it Greed rules the world, baby! FOMO for longs, pure terror for shorts—ALERT!!! Dump all metals NOW, pile into equities. High Beta or bust—High Tech only. Move FAST, minutes not hours, that’s my hot tip (wink wink). SMCI’s the play—not Tesla—oversold, over-shorted, tiny float, primed for a $20, $30, even $60 rip in ONE swing. Double, triple your cash, EASY. Took just $200M to tank it from $130 to $39—chump change. Same fireworks coming on the way up. Liquidity’s a joke—penny stock vibes with monster upside. Multi-X move is HERE. Shhh… tell only your greediest pals. This post vanishes soon—pass it on! This is the advice I gave to myself... To each its own, as the frog said wanting to get married. Disclaimer: This information is compliant with Standard III(A) of the CFA Institute Code of Ethics and Standards of Professional Conduct.Longby imcnf5c4ff13
Super Micro Computer Inc. (SMCI) - Price Forecast ReportDate: March 18, 2025 SMCI today held off on the $40.50 level today. This level is CRUCIAL! By holding this level off, it kept the higher low. There is one issue though. When I'm looking at this graph and thinking about what I will do tomorrow for SMCI, it could go either directions really. These are the two predictions that I have: Purple Line: The best hope is that tomorrow morning, we will have a break above the $43.15 level. Afterwards, I want to see a hold out on that level. If that's the case, the road to $50 will be getting close and closer. Cyan Line: If the price of SMCI does drop tomorrow from open, I imagine a drop to the $38.90 level. I won't panic yet since $38.90 isn't actually the low, the lowest low is still $37.40. I would actually try and enter into a long trade and target the $43.15 level. News: Everything looks amazing for SMCI. Yes the interview with the CEO was a couple days ago (last week), but I think the words he said does carry a lot of weight. Looking at other companies, SMCI has no lay offs, they are increasing production, and are the best company at what they do. On top of that NVDA is soon releasing there new GPU which requires liquid cooling which *hint hint* SMCI is the best on the market for. Conclusion: All in all I am super happy on the outlook of SMCI. Everything right now is demonstrating an upward trend. Lets see how things play out! Disclaimer: This is my personal trading perspective and not formal investment advice. Always do your own research and manage your risk accordingly. Longby CrayonGuy6
SMCI stock Chart Fibonacci Analysis 031725Trading Idea 1) Find a FIBO slingshot 2) Check FIBO 61.80% level 3) Entry Point > 45/161.80% Chart time frame: B A) 15 min(1W-3M) B) 1 hr(3M-6M) C) 4 hr(6M-1year) D) 1 day(1-3years) Stock progress: B A) Keep rising over 61.80% resistance B) 61.80% resistance C) 61.80% support D) Hit the bottom E) Hit the top Stocks rise as they rise from support and fall from resistance. Our goal is to find a low support point and enter. It can be referred to as buying at the pullback point. The pullback point can be found with a Fibonacci extension of 61.80%. This is a step to find entry level. 1) Find a triangle (Fibonacci Speed Fan Line) that connects the high (resistance) and low (support) points of the stock in progress, where it is continuously expressed as a Slingshot, 2) and create a Fibonacci extension level for the first rising wave from the start point of slingshot pattern. When the current price goes over 61.80% level , that can be a good entry point, especially if the SMA 100 and 200 curves are gathered together at 61.80%, it is a very good entry point. As a great help, tradingview provides these Fibonacci speed fan lines and extension levels with ease. So if you use the Fibonacci fan line, the extension level, and the SMA 100/200 curve well, you can find an entry point for the stock market. At least you have to enter at this low point to avoid trading failure, and if you are skilled at entering this low point, with fibonacci6180 technique, your reading skill to chart will be greatly improved. If you want to do day trading, please set the time frame to 5 minutes or 15 minutes, and you will see many of the low point of rising stocks. If want to prefer long term range trading, you can set the time frame to 1 hr or 1 day.by fibonacci61803
SMCI: Chart Analysis, Key Fundamentals, and Why It Could Be the Chart Analysis On the daily chart, SMCI (Super Micro Computer, Inc.) has been trading within a broad descending channel (shaded in blue). Recent price action shows a breakout from a tighter, shorter-term channel (shaded in red), suggesting the potential for a trend reversal. Key levels to watch: Support around 35.99: This level has acted as a floor in recent sessions. A pullback to this zone could provide a secondary entry for those who missed the initial move. Intermediate Support around 39.45: After the breakout, this level may serve as a short-term pivot if price consolidates. Upside Resistance near 44.99: This is a pivotal zone. A clear break above could trigger momentum buying and open the way for further upside. ATR (the red line appears to be a longer-term moving average) are starting to flatten, which often precedes a potential bullish crossover if price can remain above these key levels. On the momentum front (the green and orange RSI oscillators at the bottom), a bullish crossover has formed, supporting a near-term upside bias. Thought Process: Sure! Here's a first-person take on it: --- I honestly can't believe how undervalued **Super Micro Computer (SMCI)** is right now. This company is an absolute beast in its field—no layoffs, ever. While other tech companies are constantly "restructuring" and cutting staff, SMCI has been scaling up, increasing production, and solidifying its dominance. They’re not just good at what they do; they’re the **best** at it. And let’s talk partnerships—**NVIDIA (NVDA) and Tesla (TSLA)** are working with SMCI, which tells you everything you need to know about their credibility and future potential. They just **broke through a major resistance level**, which is a strong technical signal that big moves are coming. So why did the stock take a hit? A **CFO-related issue**—which, let’s be real, is minor in the grand scheme of things. Fundamentals haven’t changed. Demand for their high-performance computing solutions is only going up, and their execution has been nothing short of stellar. **The outlook is ridiculously strong.** Right now, SMCI isn’t just undervalued—it’s a rare opportunity. News / Reports Source A: link Source B: link Source C: link If you want to take a close look at some current news and reports, feel free to read these articles! Disclaimer: This is my personal trading perspective and not formal investment advice. Always do your own research, double check my findings, and manage your risk accordingly.Longby CrayonGuy2219
SMC I dont think its ready yet...SMCI Daily Chart Analysis & Prediction (March 14, 2025) 1. Key Observations from the Chart: • Recent Bounce Off Support: SMCI has rebounded from a key support level around $30.30 and is attempting to hold above its ascending channel. • Major Support & Resistance Levels Identified: • Resistance Levels: • $39.84 – Immediate resistance; must break for upside movement. • $45.29 – Strong resistance; previous rejection area. • $48.98 - $63.05 – Major resistance zone; unlikely to be tested tomorrow unless a major rally occurs. • Support Levels: • $39.08 – Currently being tested; a break below could push SMCI lower. • $30.30 – Major long-term support if $39 fails. ⸻ 2. Trend Analysis & Chart Patterns • Short-Term Uptrend Still Intact: SMCI is trading in a rising channel, but a breakdown could lead to a test of lower levels. • Moving Averages Acting as Resistance: The 200-day EMA around $40.32 is acting as a key resistance zone. ⸻ 3. Indicator Analysis Stochastic RSI (Middle Panel - Momentum Indicator) • Currently near neutral levels (~47.78), suggesting room for movement in either direction. • No confirmed bullish crossover yet, meaning upside momentum is still weak. MACD (Bottom Panel - Trend & Momentum) • Bearish MACD Cross Confirmed: • MACD histogram is slightly negative, signaling weak selling momentum. • A bullish crossover could indicate a shift in trend.by ReadyFor401kUpdated 3
SMCI - Let's bring it home, baby!SMCI, I'm waiting. See me? I'm standing in the doorway. The front porch light is on. Despite what you may have done in the past, I forgive you and want you to come home. NOW HIT THA TARGET!by MonsterStockPicksUpdated 226