Snap looking to go higher from here.Snap has closed the long time gap and with positive earnings it gapped up and now continuing in this direction. There is resistance at 44. Lets see how it plays that area. I am in at 37.65 with stop loss at 34.80. Will sell some into strength around 44.
1SNAP trade ideas

TECH About To Get WreckedSNAP, NOW, MU, and QCOM are my largest current positions. Expecting lower gaps to get filled over the next few weeks.
Not financial advice
Snap staged for a reversal?Snap has been trading mostly within a falling channel on the daily chart since Oct. 22. A falling channel is considered bearish until a stock breaks up from the upper descending trendline of the pattern.On Thursday, Snap was attempting to break up bullishly from the falling channel. If the stock does so, it will regain support at the 50-day simple moving average, which would mean longer-term sentiment has turned bullish. Snap began the trading day with an inside bar but quickly broke up above Wednesday’s highest price, which in Snap’s case caused the eight-day exponential moving average (EMA) to cross above the 21-day. Snap has resistance above at $43.26 and $47.92 and support below at $39.96 and $37.35.


SNAPCHAT STRONG BUYWe waiting the price go to 20.00 and when up to 25.00 that's point for entry, so we have some target and set it one by one . Every target we can get our profit or wait price up to 80.00 the last target !

SNAP | Short the greed Opened a short position just before market close and holding for a swing. Expected target is the next zone at the bottom but I will trail my stop as SNAP drops further.


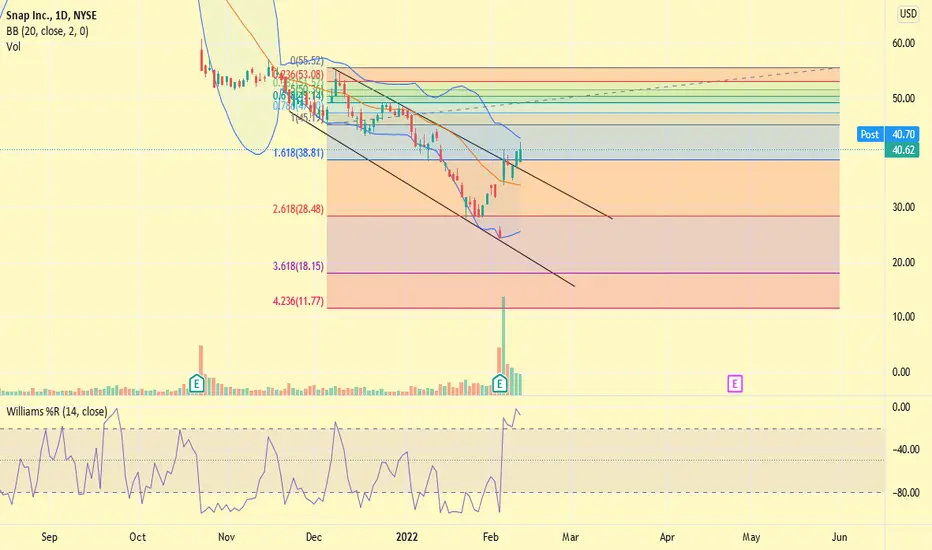
SNAP DESCENDING CHANNELSnap has been in a downtrend and with the recent earnings it has Snapped back into the descending channel. If we see a (Break Out) it will most likely be a fake out. Starting a short position at this level, Stop loss is if the weekly chart shows Bullish trend reversal. Profit take at $34.52

SnapChat (NYSE: $SNAP) Charging Up The Chart Pre-Market ⚡Snap Inc. operates as a camera company in the United States and internationally. The company offers Snapchat, a camera application with functionalities, such as Camera, Communication, Snap Map, Stories, and Spotlight that enable people to communicate through short videos and images. It also provides Spectacles, an eyewear product that connects with Snapchat and captures video from a human perspective; and advertising products, including AR and Snap ads. The company was formerly known as Snapchat, Inc. and changed its name to Snap Inc. in September 2016. Snap Inc. was founded in 2010 and is headquartered in Santa Monica, California.

$SNAP Big short opportunity -Will be looking to see how this gap fills now gaps can take years to fill or they can fill instantly
-will be watching to see if we can break into the gap and profit off the gap fill
-First PT will be 32.39 then after that we are looking to go down to 25.31
-For now keep this on watch no clear set up then no entry

$SNAP TO SEE 40 THIS WEEKSnap surges 50% and got multiple upgrades over the weekend, Im expecting a nice increase in volume driving this up into the 40.0 this week.

$Snap trade setupGood opportunity after volatile earnings report. Setup includes support and resistance lines.

Possible play for puts on SNAPNeed for SNAP to fill the gap in the charted purple, and possible be able to grab a few put plays this week . Not financial advice, opinions only

Snapchat high probability sellI think that snapchat will go down as it has been in a downtrend so far, and on the daily it has broken through the weekly level and retested it. The graph explains the rest

SNAP: Good Time to ShortSnap may have had its first positive earnings, but it's still WAY overvalued. If you look at it's previous earnings, it's balance sheet, and current P/E, you can see there's nothing to get terribly excited about. With that being said, it's also respecting the channel as well as a gap to fill to the downside. Could be a great put buying opportunity.
Not financial advice

SNAP: WHERE IS THE RESISTANCE AND SUPPORT?Hello friends, today you can review the technical analysis idea on a 1D linear scale chart for Snap Inc. (SNAP).
The chart is self-explanatory. Death cross on the 1D chart recently occurred. RSI is above the resistance line with a possibility for a re-test. MFI is at the resistance line with an attempt to break out. SNAP's price touched the 0.618 Fibonacci Retracement level before coming back down. It will need to break the 0.618 and 0.786 level to continue the rally upwards. There is resistance with the EMA Ribbons and the top line of the Descending Broadening Wedge. Volume has picked up. Please review the chart for the remaining notes.
Included in the chart: Trend line, Support and Resistance Lines, RSI , MFI , Death Cross, Simple Moving Average, Fibonacci Retracement, EMA Ribbons, Volume.
If you enjoy my ideas, feel free to like it and drop in a comment. I love reading your comments below.
I have additional charts below on cryptocurrencies, stocks and more to review. Check them out!
Disclosure: This is just my opinion and not any type of financial advice. I enjoy charting and discussing technical analysis. Don't trade based on my advice. Do your own research! #cryptopickk

SNAP USA Sun Storm Investment Trading Desk & NexGen Wealth Management Service Present's: SSITD & NexGen Portfolio of the Week Series
Focus: Worldwide
By Sun Storm Investment Research & NexGen Wealth Management Service
A Profit & Solutions Strategy & Research
Trading | Investment | Stocks | ETF | Mutual Funds | Crypto | Bonds | Options | Dividend | Futures |
USA | Canada | UK | Germany | France | Italy | Rest of Europe | Mexico | India
Disclaimer: Sun Storm Investment and NexGen are not registered financial advisors, so please do your own research before trading & investing anything. This is information is for only research purposes not for actual trading & investing decision.
#debadipb #profitsolutions

I hate snapchat but it looks like it has upside from hereafter this latest earnings and buying it appears to have upside and potentially a reversal

Snapchat down 25% BEFORE earnings?! Facebook strikes again?!25% is insane for a company to fall in one day on ANOTHER company's news. Holy wow. Call it the "Facebook Effect", and it may be responsible for destroying the market like a cancer.

SNAP eyes on $22.90 going into earnings: SnapChat to Do-or-DieAssets have many Impulses in a lifetime, but only one "Genesis" Fib.
Genesis as in "inception", programmed with all of the DNA it will ever have.
That Impulse predetermines the "Growth Layers" that an asset must follow.
$ 22.90 is the next Golden fib, whose sisters above were clearly reactive.
$ 20.26 and 18.63 are Semi-Major ratios before the next Golden fib 15.99
$ 34.07 above will be the key resistance if we get a "good" earnings report.
.
I do not use "Fibs" in the "traditional" manner (retracements).
I use Fibs to plot "Ripples" (extensions) created by "Impulses".
Then look for "Confluences" to map the "interference Pattern".
My TV collection of ideas detailing the Concepts:
Chapter 1: Introduction and numerous Examples
Chapter 2: Detailed views and Wave Analysis
Chapter 3: The Dreaded 9.618: Murderer of Moves
Chapter 4: Impulse Redux: Return to Birth place
Chapter 5: Golden Growth: Parabolic Expansions
Chapter 6: Give me a ping Vasili: 'one' Ping only
Chapter 7: The Mighty 2.618: like a Rook in Chess
.


SNAP Inc. a company with Debt and Negative free cash outflowIf you haven`t sold SNAP at my call here:
Then you should know that a strong support volume area is between $12 to $18.
I expect to touch that area after the earnings call.

