1SNAP trade ideas

Snapchat (SNAP) Looks Poised To Challenge All Time HighsSnapchat (SNAP) Looks Poised To Challenge All Time Highs

$SNAP Update, 65$ IncomingThis has been a really great snapchat trade, approaching my first 65$ price target in the near term, most likely sometime this week. Passing the 65$ level would then give me a second target near the ATH of 74$+. Obviously this cant go vertical to 74$, but look for some resistance near 68$ and then a bounce off 65$ as old resistance acts as support for the run in the 70's. If tech shows continued momentum, this easily goes to those levels.


$SNAP - strat methodI see some indicators using strat method on daily, weekly and monthly. I would only trade this in a swing or day trade next week. on the watchlist

Snap, Sneaking UpOne of may favourite tech stocks in recent years. Feels like an strong (dare I say explosive) move coming if it clears $62.70-62.80.
Now: $62.05
Temporary failure below: $58.80

Snap Put/ SellThis is not financial advice. My projection here is pure7based on technical analytics and nothing to do with fundamentals. I’m expecting least 22% retracement.

Snap possible price action Wait for the breakout then buy on pullback. Chart looks clean and easy. Make your own decision


Bull Trap in SNAPWhy do I believe this could be a Bull Trap?
If you look at the previous times SNAP reached this level (upper border of the wedge), always got rejected and could not close above the upper border of the wedge!
In the past 5 days price climbing up but the volume dropping!
Makes it a good case for short!
The only problem is Max Pain:
58-59 for this and next week!

$SNAP Bouncing off Channel Top, Bullish With Snapchat having a selloff the previous day, I thought it was a healthy pullback after having nearly a 13% move in a few days, the top of the channel has acted as support and more buyers have entered which will push this higher to $65-$70 level, path of least resistance. Working out amazingly!

$SNAP Update - Looking for Support Snapchat cleared through its channel range the other day, topping nearly $61, a pullback today seems healthy with an almost 7% move the previous day. What I am looking for next is some support on top of this ascending triangle, if price can hold above approximately $58.50 for the week, I think it will give traders yet another opportunity to enter for a move towards $70. Watch tomorrow as the closing candle green will give this further strength in the near term.

$SNAP Approaching ResistanceSnap Inc. shares saw strong growth today and are nearing a very important resistance level. If this level breaks, $SNAP could potentially be headed much higher, which is probably the favorable outcome here, but there is a possibility that this resistance level will hold and we will need to consolidate a little more before breaking out to the upside. Like and follow for more :) Good Luck!


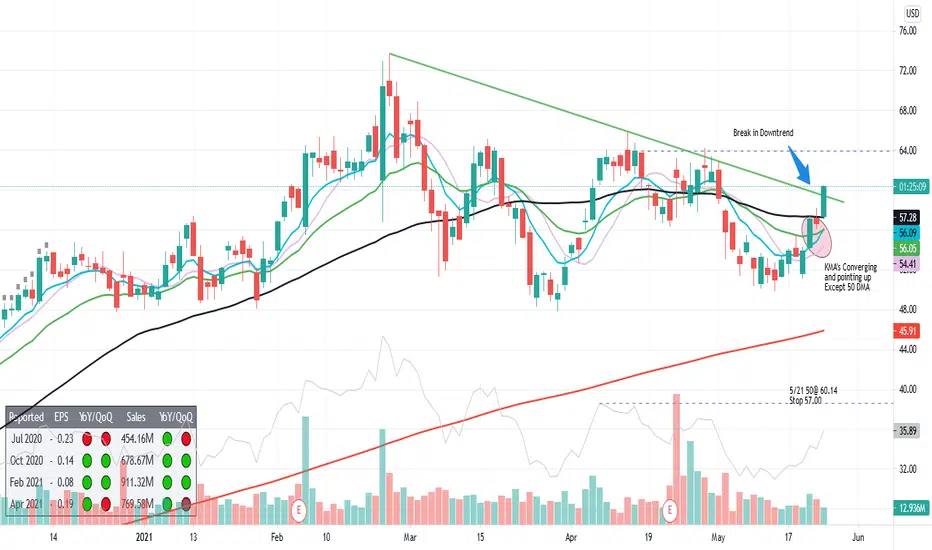
$SNAP Breaking Up?I just opened a 'very early" position in $SNAP. I like how the KMA's are acting and the fact that it seems to have broken the downtrend line. It looks like there is going to be resistance in the $62 to $63 area which is probably a safer entry point. However, I like my risk level here as I can run a very tight stop. Note on Chart. Ideas, not investing / trading advice.
Symmetrical TriangleLooks to be breaking to the upside.
No recommendation.
A symmetrical triangle is a chart pattern characterized by two converging trend lines connecting a series of sequential peaks and troughs. These trend lines should be converging at a roughly equal slope, with one sloping down and the bottom line sloping up.
The lower line of the triangle, or lower trendline, can be thought of as the demand line, which represents support on the chart. At this point, the buyers of the issue outpace the sellers, and the stock's price begins to rise. The top line is resistance until price breaks the upper trendline.
Throwbacks do happen frequently, and sometimes a symmetrical triangle will break to the downside, before turning around only to break the top trendline.

$SNAP Update - Position Up 12%, Important Price Level & Paths An update on Snapchat from last week, we have now reached the top of the bullish pennant formation, an important level to see where the market wants to bring this in the short term. Currently sitting on the top of the pennant, representing a resistance level, watch closely today and tomorrow to see where traders want to bring this. There are two path predictions I have for the short term, a green candle closing above this pennant would give me confidence for a breakout towards $70. The second path would indicate if the top of this channel acts as resistance, meaning the market would continue to consolidate within the channel and attempt to breakout at a later date.
An answer for where this will go will likely be answered by the close tomorrow.

SNAP - short playOverall market, not favorable for techs
weak fundamentals
MAs, RSI -
all signs of a easy short at least to the next strong support level at 48

SNAP - LongReally nice set up on here on SNAP. You have a triangle pattern on the daily with a nice bounce off the lows. Upper trendline meets the golden pocket retracement. Low risk entry here with a potential move up to the $60-62 range, with a clear stop on a break of the lower trendline around $51.


SNAP $55 Puts 5/28 expSnap approaching a bit of a sell-off this off
Confirmation:
-Rejection off the 50 MA (red)
-Hit top off downward channel
Enter: $57.15

