$SNAP$SNAP
$53.5 - 54 a solid candle formation into and above this area would be entry signal with contuining momentum upwards
$58 - 59 area of interest #1 where i believe price could be rejected or held up, regardless approaching that level if trade occurs immediatley take half profits or could take full profits all roll 1/4 or 1/2 of the profits based off reaction of box it gets rejected go puts and if it doesnt go long
$61.5 - 64 area of interest #2 where i believe price will forsure be rejected and short term trend/ the trade will for sure be over i could be wrong and i would love to in this situation but if not manage the trade accordignly
1SNAP trade ideas

SNAP (Crackle) then POP ??I am late of this one.
Nice Gartley Harmonic ( although I would have liked a deeper XA retrace) together with an AB=CD formation.
The oscillator at the bottom has been quite good at calling price strength.
The way I would play this is to wait for the current run to play out then consider a position at point D. (~$51)
Use tight stops if you enter. Expected targets are shown. Don't chase.
As usual do your own DD. Know that this company has and continues operates at a loss.
Earning are in August.
S.


SNAP - Bounce potentialEntry: 52.50 - 53
Upside potential:
T1: 11%
T2: 19%
Downside potential:
6% - 7.5%
Risk/Reward -
T1: 1.7
T2: 2.8


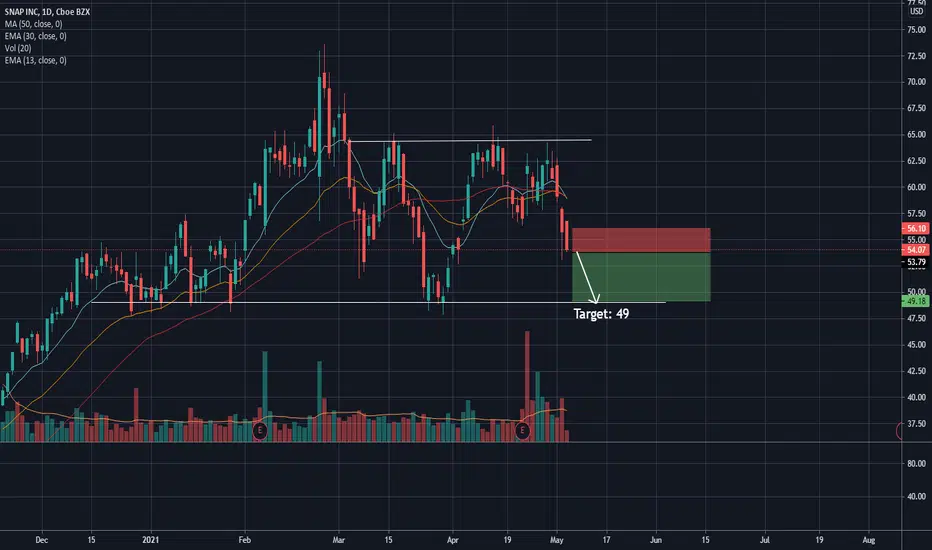
SNAP ContinuationSNAP has broken down. Looking for a continuation to the downside of the next several days to the bottom of the range, which is at the 49 area where support is.
SNAP Still deciding where to go?Up or down still trading in range... as it dips I would buy. No analysis just what I see.

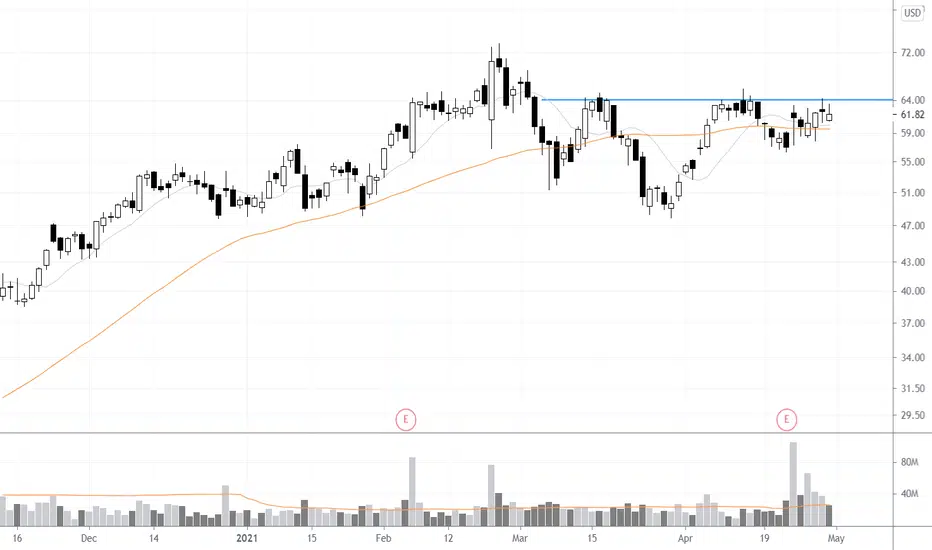
SNAP Resistance Levels SNAP has been trading inside the blue triangle for several months now. Marked on the chart are a few support zones which could serve as resistance in the short term. I'm watching for a retest of ~$58 after SNAP's selloff today. The market reaction across the board today seems to have been fueled by Janet Yellen's comments this morning on increasing interest rates. I do anticipate that growth stocks such as SNAP will be impacted pretty heavily when the Fed begins raising interest rates. However, under the Fed's current loose-money policy, that doesn't seem to be an immediate risk.
Last week we tested the inverted H&S neckline ~$64. Considering the extra volatility surrounding earnings, as well as the support level at ~$33.32, I don't think that today's price drop justifies ruling out the H&S pattern. If buyers return across the market and volume picks up, I think that price could attempt to climb back towards $64. Waiting to see which direction the market takes, with the next importance support zone being the triangle's base ~$48.50.


SNAP ideait seems to be forming a ascending triangle on the 1hr timeframe. A Head and shoulder on the daily timeframe , and a ascending triangle on the weekly timeframe. A bullish pattern within a bullish pattern within a bullish pattern . I guess SNAP is bullish .. lol

$SNAP Basing around is 50 MAWhile the setup looks promising. The social media sector been split in half between bearish (Twitter/PINS) and bullish (Facebook/SNAP). Hard to tell who is going to pull who at this point. That said, a daily close above $64 is a good start but I don't see this starting a new uptrend unless that industry is back in full participation.
$SNAP more upside in sightRecent price action is showing that 50% retracement held nicely at a support level.
I´m taking the trade if friday´s high is broken (@63.19).
If recent bottom is breached (@56.43, trade is invalidated (or stop loss if trade had started).
Targets are:
69.96 (1:1 risk/reward)
83.44 (3:1 risk/reward close to 161,8% fib extension)

SNAPCHAT CUP AND HANDLEPrepare for a nice bullish run on snapchat after handle confirmation. Take profits when it breaks pitchfan or at fib levels.


SNAP Might Snap Out Of Ascending TriangleSNAP is bouncing around an ascending triangle in the daily, 4 hour, and 1 hour timeframes.
There is a good amount of green volume on the daily, which makes me believe their is a good chance of a break out within the coming days/week.
According to the resistance on VPVR, if SNAP can break around the 62.50-63.00, it could reach All Time Highs once again.

SNAP (Snap Inc.) - Bullish Quarter aheadSnap Inc. provides technology and social media services. The Company's principal product Snapchat, is a camera application that helps people to communicate through short videos and images. Snap Inc. is headquartered in Venice, California.
Analysis/Commentary
Strong EPS and Sales Growth Y-on-Y
Based on the study of the previous quarterly earnings reports and subsequent price moves:
- Heiken Ashi chart already indicates further move upward
- Slow and Fast MACD's are neutral at the moment, but I anticipate further push upward over the coming days - get your timing right!
- Expectation for the price to move to MID TARGET over the quarter
- Trailing stop-loss on price above MID point
GOOD LUCK.
DO YOUR OWN RESEARCH!
