SNAP: What's Bad for TikTok is Good for SnapchatAfter the TikTok appearance in Congress I do not think the current administration will have the political capital to do anything but ban TikTok. The proposed deal to have TikTok sold from it's Chinese owner seems unlikely after Beijing declined it and also after the CEO got grilled in Congress and did not offer any answers to ease politicians concern the the CCP can manipulate the content on the app. I expect TikTok to be banned in the US. Snapchat stock has been consolidating around the $10 level for almost a year now. I think a TikTok ban will benefit SNAP big time and be the tailwind it needs to break out.
1SNAP trade ideas

Large momentum shifting structure for SNAPSNAP is showing one of those large, curving momentum shifting structures. I'm not 100% sure the strategy to trade something like this but for people looking for buy and hold for a little while, this could be something to consider.

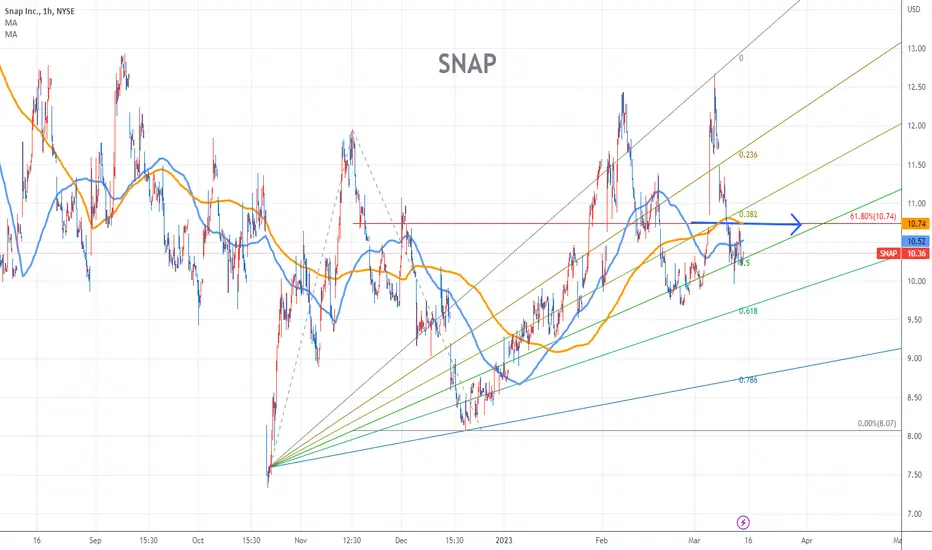
SNAP Stock Chart Fibonacci Analysis 0314231) Find a FIBO Slingshot
2) Check FIBO 61.80% level
3) Entry Point > 10.74 /61.80%
SNAP SELLHello . There is a possibility that Snapchat shares will drop. Once the price reached a strong resistance 12.25. The market bounced last time. And a very negative candle in the four-hour frame: Note: If you like this analysis, please give your opinion on it. in the comments. I will be happy to share ideas. Like and click to get free content. Thank you

Short SNAP | All time low $4.82 SNAP should change it's name back to Snapchat so investors know what it is, because right now, all it has done so far is snap the bulls necks. Snap is already down 87% from it's ATH and now looks ready to test its ATL after the past week's hard rejection at $12.67.

Snap Tried to Rally But it Didn’t Last LongSnap has been rallying as lawmakers move against TikTok, but traders may be selling the news.
Today we’ll consider the daily chart of the social-media company, which has struggled since growth names hit the wall over a year ago.
The first pattern is the jump above $12.50 on Tuesday, fueled by the news from Capitol Hill. SNAP failed to hold those gains, resulting in false breakout above the February high.
Next is the 200-day simple moving average (SMA). Prices remained below this long-term trend indicator during the entire decline that began in October 2021. This week’s rally was its first test of the 200-day SMA, which may trigger some alerts for trend followers.
Third, the stock gapped lower following its last two quarterly reports.
Finally, stochastics may be peaking near overbought territory.
TradeStation has, for decades, advanced the trading industry, providing access to stocks, options, futures and cryptocurrencies. See our Overview for more.
Important Information
TradeStation Securities, Inc., TradeStation Crypto, Inc., and TradeStation Technologies, Inc. are each wholly owned subsidiaries of TradeStation Group, Inc., all operating, and providing products and services, under the TradeStation brand and trademark. TradeStation Crypto, Inc. offers to self-directed investors and traders cryptocurrency brokerage services. It is neither licensed with the SEC or the CFTC nor is it a Member of NFA. When applying for, or purchasing, accounts, subscriptions, products, and services, it is important that you know which company you will be dealing with. Please click here for further important information explaining what this means.
This content is for informational and educational purposes only. This is not a recommendation regarding any investment or investment strategy. Any opinions expressed herein are those of the author and do not represent the views or opinions of TradeStation or any of its affiliates.
Investing involves risks. Past performance, whether actual or indicated by historical tests of strategies, is no guarantee of future performance or success. There is a possibility that you may sustain a loss equal to or greater than your entire investment regardless of which asset class you trade (equities, options, futures, or digital assets); therefore, you should not invest or risk money that you cannot afford to lose. Before trading any asset class, first read the relevant risk disclosure statements on the Important Documents page, found here: www.tradestation.com .

SNAP daily, it's showtime!SNAP has had a nice pullback after earnings, and now it is low basing on the 50-day MA and at the 0.618 FIB retracement and $10 even dollar amount, which acts as a magnet line. It is unbelievable how these areas of support or resistance are valid if we draw or mark them correctly. SNAP will have to decide if this is a bull pullback or if, after a low base breakdown, we will see new lows.
Volume is falling with consolidation, which is a good sign for the possibility of a bull pullback.
The price is below all major MA, which is bearish.
RSI has cooled down after an extreme and is now neutral.
MACD is ticking lower while both the MACD line and signal line are at the zero areas, or the "to be or not to be" area. If it drops below the zero line, then we can't watch for a bull pullback anymore.
Overall: SNAP is in a dangerous area for bulls. It is low basing at a major support line. If it breaks down from the low base formation and breaks below the blue dotted line, a short position would be triggered. The first area of support after that breaking low base would be the trend line, the blue dotted line, and if that would not hold, support would be the lows from 2022, the blue area of support.
However, if SNAP finds its buyers and we start to move up on strong volume, this would be the perfect area for a bull pullback to be triggered. But remember, a bull pullback can only be triggered if it does not drop below the 0.618 FIB retracement area, meaning the price cannot drop more for us to call this a bull pullback.

I can't buy this stock, even though it would be quite interesting after a 90 percent drop. A set of rules is a set of rules, even if the picture is technically frenetic. However, the results calculated by Optistock and Gurufocus sites are weak. The currently monitored return on investment (ROE) is also disgraceful, even though the only expectation here is that it should show a plus figure, for which I see -45.8%.

$SNAP: Weekly trend reversal?Interestingly, $SNAP is going for a 2nd attempt at a long term trend reversal here, worth noting. If it holds over $9.85 we could get a substantial rally out of this one. It is interesting because market participants are seeing $SNAP as a kind of reflection of the economy, and as a leading indicator for $META and $GOOGL.
Let's keep an eye on this one, I'm not in the trade in this case but following it for analysis purposes.
Cheers,
Ivan Labrie.

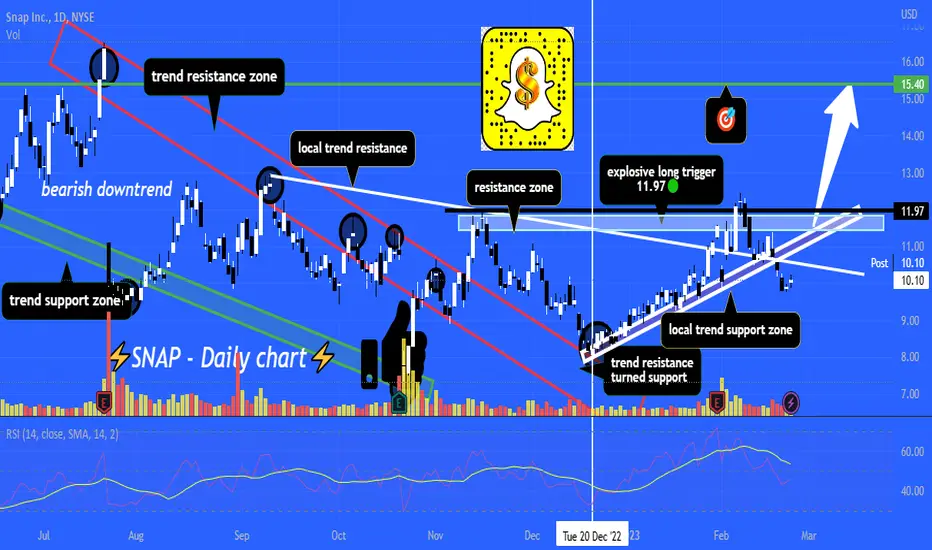
SNAP bears lost control since December 🐻noticed how price action changed from bearish to bullish since the big trend resistance turned to support in December.
watch from climb back above 12, if that comes push to 15-20 is possible.. like and follow for more! 💙
SNAP looking bearish. $SNAPSNAP is presenting the same patter of bigger players like SPY, QQQ or AAPL. However SNAP is below the 200 MA that relates with a downtrend, so this plus the breakout, plus the WTO high and getting lower shows bearish power. We'll see.

using ARKK as an indicator to carcass pick stocks $snap $arkk If and when stocks finish the bear market, there will be deals at fair prices. snap is a good example of a once over valued and over exuberant stock whos earning guidance and result kept coming down after peak 2021. If arkk and the rest of the growth stocks keep trending lower as we may or may not be already in recession, I'm checking my favorites list to see what value Id be happy to grab deals. Happy hunting.

Snap entering a critical areaSnap is close to go into a very critical area as shown in the chart. if it goes beyond then it is a strong indicating of a bullish move.

SNAP Stock Chart Fibonacci Analysis 021823Trading Idea
1) Find a FIBO slingshot
2) Check FIBO 61.80% level
3) Entry Point > 10.3/61.80%

$SNAP with a bearish outlook following its earnings #Stocks The PEAD projected a bearish outlook for $SNAP after a Negative over reaction following its earnings release placing the stock in drift C.
SNAP 03/17 11Pcpi on this tuesday, bearish on this number. SNAP finally have a doji red bar on weekly chart
wait it bounce to 11-11.5 level to entry put, target 9.5-10.
The market bounce shows weakness after a long run.
META new high, PINS failed, BMBL failed.
The XLC sell off last week

SNAPBUYAn opportunity to buy Snapchat stock with a breach of the bearish flag and a good retest with a positive candle

SNAP - could be emerging from baseSNAP plunged 10.3% on 1st Feb after announcing yet another quarter of dismal results. However, what happened after that is interesting.
The stock began to recover steadily in the last 3 days on good volume, a stark contrast to the correction the general market was experiencing. This exhibits "hidden" strength / support for the stock.
There is a good chance it is going to test a critical neckline @ 12.94 in the coming days. Should it begin to break above this neckline and also the 200 day MA, then the odds are good then it has entered into a recovery phase.
Let's wait and see.
Disclaimer: Just my 2 cents and not a trade advice. Kindly do your own due diligence and trade according to your own risk tolerance and don't forget that money management is important! Take care and Good Luck!

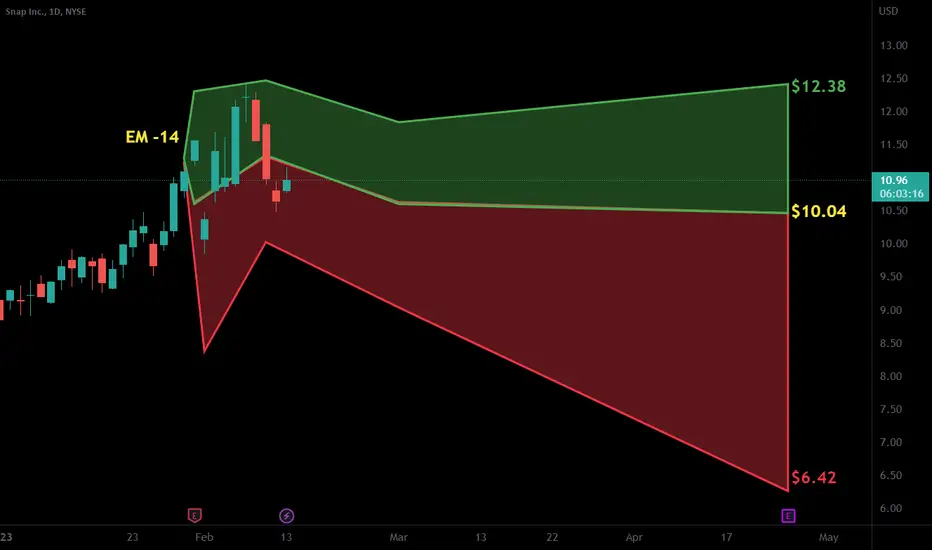
$SNAP - Long Trade IdeaMore information to be provided in future comments. I want to post this before closing.
Average: $12.00

snap stock med term analysisas noticed on the chart snap stock break a resistance area with high volume candle, It will move the price to next resistance area
the gap should be close as well as illustrated on chart

SNAP shortNow I am bearish on SNAP:) IMO it can go down to $9.04 again.
Entry price is $11.00 and stop loss level is $11.67. Risk/reward is 2.93.

SNAP Snap Options Ahead Of Earnings | Who`s still using it?!If you haven`t bought puts with me here:
Then looking at the SNAP Snap options chain ahead of earnings , I would buy the $10.5 strike price Puts with
2023-2-3 expiration date for about
$0.84 premium.
If the options turn out to be profitable Before the earnings release, I would sell at least 50%.
Looking forward to read your opinion about it.

SNAP strong bullish to expect
Hi viewers, SNAP technically watched here expecting strong bullish push in next periods
TP1:13
TP2:14
