Why We See 100%+ Upside In SoFi Over The Next 3 YearsAfter soaring to nearly $28 per share during the SPAC-fueled fintech boom in 2021, SoFi Technologies (SOFI) crashed back to earth, trading under $5 as rising interest rates, regulatory headwinds, and lack of profitability dimmed investor optimism. But the tide has turned.
Over the past year, SoFi has reshaped its business and posted significant growth. Shares are now up 247% since our previous bullish call at $6. With the company now profitable and diversifying revenue, we'd argue there’s still upside ahead.
💼 A Stronger, Diversified Business
SoFi has evolved from a student loan-focused lender into a full-spectrum fintech platform. It now operates across:
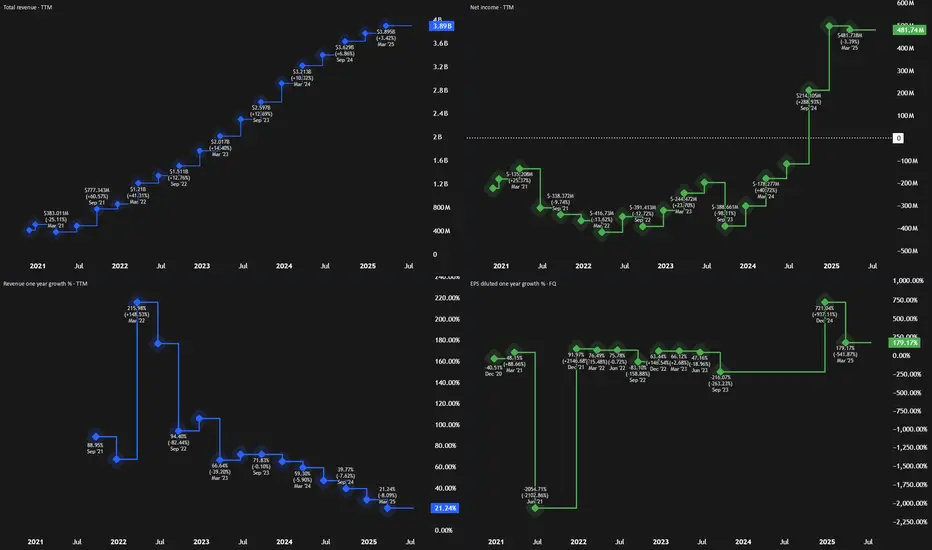
Lending: $413M in Q1 revenue
Financial Services (consumer banking): $303M
Technology Platform (B2B): $103M
While lending still makes up the majority, the tech and services segments are growing fast—especially financial services, which doubled revenue YoY and tripled profit. SoFi's white-label platform also gives it a SaaS-like recurring revenue profile.
Q1 results showed:
Revenue: $770M (+33% YoY)
EPS: $0.06, with a $31M revenue beat
This business mix gives SoFi more stability and better scalability than many traditional financial firms.
💰 Valuation: Pricey vs. Banks, Cheap vs. Fintech
Critics point to SoFi’s rich valuation—trading at over 8x sales—as a concern. But when compared to other fintechs like NuBank (12x sales) and Robinhood (28x), SoFi looks much more reasonably priced.
On a forward earnings basis, SoFi trades at ~32x GAAP EPS, and if growth continues, this could drop below 30x. That’s appealing for a company expected to grow:
Revenue: ~25% annually
Net income: ~33% annually
By 2027, analysts project $1B in operating income, double today’s figure. If SoFi maintains current valuation multiples, this alone could double the stock in 3 years.
⚠️ Risks to Watch
Regulatory scrutiny in the financial sector
Cyclicality of consumer lending
Intense competition from firms like Robinhood, Chime, and Coinbase
Despite these challenges, SoFi’s expanding ecosystem and growing brand strength position it well.
✅ Final Take: Still a 'Strong Buy'
With accelerating revenue, expanding margins, and a scalable business model, SoFi has moved beyond its hype-fueled origins and is now a real fintech contender. Even after its rally, its valuation still leaves room for meaningful upside.
Rating: Strong Buy
1SOFI trade ideas
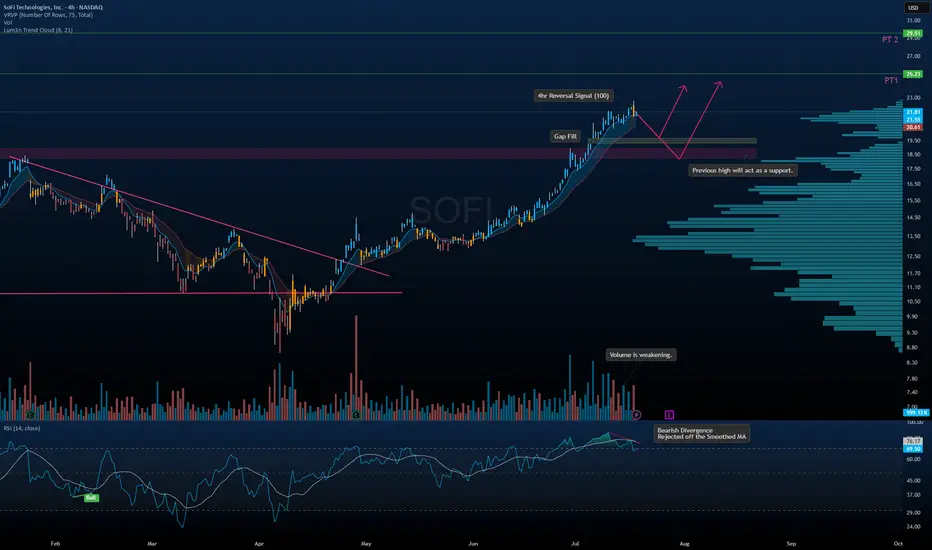
$SOFI - Long-Term Setup Brewing? Pullback First?I’m extremely bullish on SoFi long-term, but the chart is signaling a potential pullback opportunity before the next leg up.
🔹 Technical Breakdown:
• Bearish Divergence on RSI with rejection off the smoothed MA
• Volume weakening as price moves higher – classic sign of exhaustion
• 4hr Reversal Signal flashing near local highs
• Gap Fill zone near $19.50 + previous highs = strong support zone
• Lum3n Trend Cloud still bullish — trend intact unless breakdown occurs
🎯 Targets:
• PT1 → $23.25
• PT2 → $29.50 (longer-term structure extension)
🧠 Thesis:
Letting price come to us is the smarter move here. I’m watching the $19.50–$20.00 zone closely for potential accumulation. That level has strong confluence with volume shelf, support, and fib structure.
How to Do Your “Trading Homework” (The Smart Way)
If you’ve been following this channel, you’ve heard me say it many times:
Trading is war — and you should never enter a battle unprepared.
But here’s the real question:
How exactly do you prepare?
The answer lies in a powerful strategy I use called:
💡 Thematic Investing
Read more here →
Instead of chasing news or signals in isolation, thematic investing means:
You first understand where the world is heading
Then you position yourself ahead of that move
It’s not about reacting. It’s about anticipating.
---
❌ What Most Traders Do Wrong
Most beginners:
Follow one tweet
See one red or green arrow
Watch one chart pattern
Then they jump in blindly.
That’s not trading — that’s guessing.
News headlines and chart moves reflect what already happened.
But your edge comes from understanding what’s likely to happen next.
---
✅ What I Do Instead (with QS AI)
Back in the day, doing thematic analysis manually could take hours of reading across dozens of news sites, earnings calls, and macro reports.
But now?
QS AI does the heavy lifting for you — in seconds.
Here’s how I do my “trading homework” every week using QS signals:
---
🧠 Step 1: Start with the News Theme
Go to 📰news-signal — let the AI scan hundreds of headlines and summarize the key themes shaping the week.
Ask yourself:
What’s the main event or policy shift?
Which sectors are directly impacted?
Who are the winners and losers?
---
🔎 Step 2: Zoom Into Sectors or Stocks
Once you spot a theme, use other QS signals to dig deeper:
⏰0dte for fast-moving trades (same-day catalysts)
📅weekly-options for 1–5 day plays
💸earning-signal for earnings-related positioning
🔄swing-signal for broader trend/position trades
---
📈 Real Examples of Thematic Trades
Let me walk you through a few past trades — all built off this exact process:
✅ BBB Defense Play
Theme: Bill passed removing EV credits, boosting defense
Strategy: Long PLTR / Short EV sector using 📅weekly-options
✅ Robinhood Crypto Tokenization
Theme: Robinhood’s crypto product event
Strategy: Crypto stocks pump → took profits early
✅ Tesla Robotaxi Week
Theme: TSLA reveals AI & robotaxi push
Strategy: Long TSLA / Short UBER
✅ Earnings Play: MSFT vs AAPL
Theme: MSFT cloud beat, AAPL revenue drop
Strategy: Long MSFT / Short AAPL using 💸earning-signal
All these trades started with thematic awareness → followed by precise signal-based execution.
---
⚙️ Your Homework Checklist (The QS Way)
Before every week or trade, ask:
📰 What is the major theme driving markets this week?
🧠 What sectors or companies are most impacted by this theme?
🔀 Can I find a relative strength/weakness pair to trade?
⏳ What’s the best time frame? (0DTE, weekly, swing?)
📊 What do QS signals say about timing, momentum, and volatility?
---
🤖 Why QS AI Gives You the Edge
Doing this manually would take you 5–10 hours a week.
But with QS AI:
You scan the entire news cycle in 10 seconds
Get real-time themes and reactions
Pair it with high-quality trade setups
Prepare your game plan before the market opens
This is how we prepare smarter, not harder.
No more chasing arrows.
No more gambling.
Just clean, thematic, risk-aware, high-conviction trades.
---
🏁 Final Thought
There are no guarantees in trading.
But there is a smarter way to prepare.
Thematic investing + QS AI gives you the best shape to step into the market and fight with confidence.
Follow where the world is going — one theme at a time.
That’s how we trade with QS. That’s how we print. 🧠💥💰

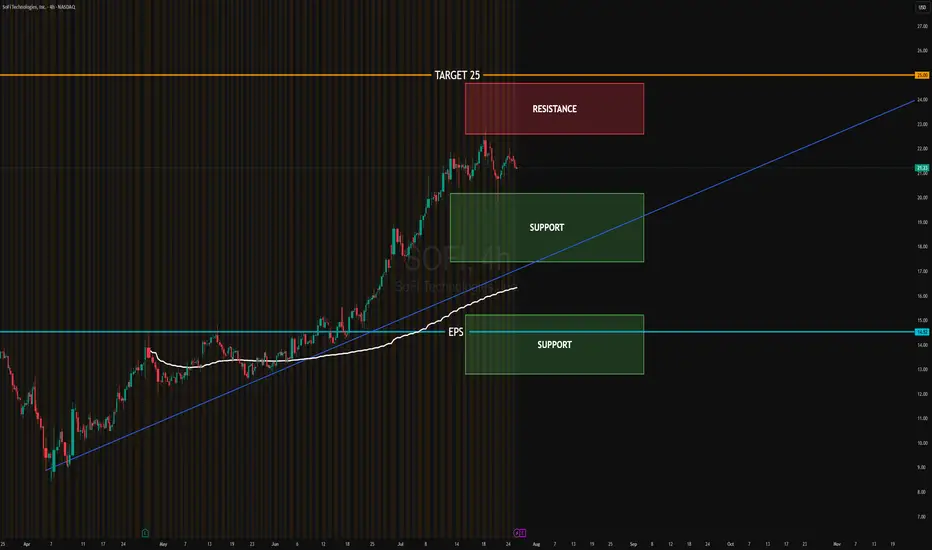
SOFI EARNINGSResistance Zone: $22.50 – $24.00
Support Zone 1: $18.00 – $19.50
Support Zone 2 / EPS Breakout Line: $14.50
Bullish Target: $25.00
Trendline: Still intact — medium-term trend remains bullish
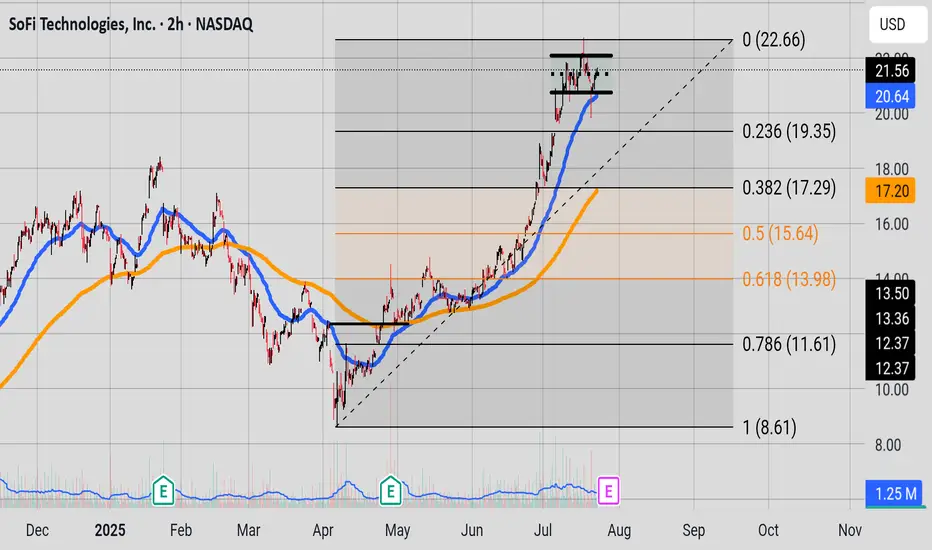
Parallel StructureWe have a nice parallel structure sitting on top of a 50 EMA (in blue). A consolidation is happening. Interestly enough the 200 EMA(in orange) is close to the 0.382 Fib level. On the weekly chart you can see the bears gearing up. But the bulls are still in charge. Price needs to hold the 20.64 price range for the bulls.
High Wave CandleSOFI has finally reached it's resistance level around 23.84. Last week candle was a High Wave Candle. If we get a strong close above 23.84 that probably means the bulls are marching on, if we get a bearish close below 19.55 that may mean the bears have stepped in and are looking to pull prices down to the golden zone of the Fib Level. Observe the bearish divergence with the RSI and price, also observe how Stochastic RSI and RSI are in overbought territory.

LONG 4HR Wave Count Possibilities
Using the Weekly time frame, Wave 1+3 of a larger degree shows a possible extension to the 1.68 extension which is a common wave 5 of a larger degree target . That Price Target being $26.35.
In April of this year the price reacted to a Reversal Pivot Point but failed to form a proper impulse for wave 1. Price then gapped above the price resistance line for the year of 2025 and the 100 WMA.
As of now, price is expect to target $19.43 in a move to finish out wave 3 of a macro degree. Wave 4 typically retracing to the 0.236 or 0.382 level has been displayed to align with the current uptrend trendline.
I have also displayed the possible points of interest for Fib levels for an approach to finish out wave 5 of a macro degree. I expect Price to stall and face resistance in the golden pocket extension of the Fib levels.
None of this is financial advise and strictly for educational purpouses.

Sofi long ideaHi,
SOFI, at a key technical juncture, reacted to the imbalance or equilibrium of the quarterly bullish breaker. With one level of algo-targets still to test, I'll be looking to add on any downward opportunities.
NFA

$SOFI - Just getting started!NASDAQ:SOFI - Just getting started!
Monthly CupnHandle Breakout
Looks like we will push into new ATH's this year.
Targets: $23.73/ $28.18/ $32.57

SOFI 4-Hour — “Measured-Move” Breakout Toward $20.8 → $22Structure: Price broke out of a year-long falling-wedge and then punched through an ascending trend-line confluence at ≈ $17.00–$17.50.
Impulse Leg (Yellow): The vertical rally that followed is ≈ $3.75 tall. Projecting that height from the breakout pivot ($17.00) gives 100 % extension = $20.78.
Target Zone (Violet Box): $20.8 – $22.0 aligns with
100 % measured-move projection
Prior all-time swing high (~$20.5, Jan-2024)
A thin volume-profile “air pocket” between $19 and $22 (little resistance until the upper edge).
Next Level Up: 127.2 % fib extension sits at $24.15—that becomes the stretch target only if $22 is cleared decisively.

Key Level and QuestionsWe have strong momentum RSI 68.81 at a key level 18.55 . Will the bulls push through the key level at 18.55 and march to next key level at 23.30 price area or will bears take price down to the 16.00 down price level?

Long for now but would suggest taking profits. Even though major move already happened, I can see it going to 20-21.5 before we hit supply and head lower into next buy zone, unfortunately I don't see strong support until 15 area. Macd's play a role as momentum from buying is going to turn into selling soon.

SOFI Breakout Watch!🚀
Pullback into triangle support — bulls eyeing $19.61 next 📍
Entry: $18.20 | SL: $17.80 | TP: $19.61
Pattern says “retest and rip!”
#SOFI #BreakoutSetup #StockAlert #BullishMove #ProfittoPath

Super performance candidate NASDAQ:SOFI has shown strong quarterly earning's growth, with its latest earnings quarter reporting 30% YoY, improving from losses to profits at an impressive rate
Being positioned as a Leader in the FinTech sector and significant institutional adoption, reflecting investor appetite and confidence
Aiding with a key Breakout day,
I have reasons to believe this security price could increase.

SOFI Classic BUMBUM Breakout !I think I am beginning to like this classic bumbum formation.
NASDAQ:SOFI broke from the classic bumbum formation and retraced back to its support levels at $8.
It has recently started making a bullish reversal move back to $15, in the turn forming an inverse head and shoulder formation.
If the current momentum is sustained and the $16 resistance is cleared; I expect a move towards $23.34.
💼 Position
Type: SOFI 15 Call
Expiry: July 11, 2025
Quantity: 10
Average Cost Basis: $0.58
Date Purchased: June 10, 2025
Last Price: $1.01
Total % Gain/Loss: +75%
Cup and Handle - 67% Upside if we get the CUTS As of Friday, June 27, 2025, at 9:01:38 PM PDT, here's a breakdown of SoFi Technologies Inc. (SOFI) stock:
Current Price & Performance:
Last Price: $17.18 (as of 4:00 PM ET on June 27, 2025)
Today's Change: Up $0.41 (2.44%)
After-hours price: $17.22 (up 0.23% as of 8:00 PM ET on June 27, 2025)
Previous Close: $16.77
Today's Range: $16.84 - $17.52
52-Week Range: $6.01 - $18.42
Key Financials (as of March 31, 2025, Fiscal Q1 2025 reported April 29, 2025):
Market Cap: Approximately $18.99 billion
Earnings Per Share (EPS): $0.06 (reported), which beat the expected $0.031.
Revenue: $770.72 million (reported), which beat the expected $738.91 million.
Net Income: $71.12 million
Analyst Sentiment & Forecasts:
Consensus Rating: "Hold" based on 39 analysts.
13 Buy ratings
19 Hold ratings
7 Sell ratings
Median Price Target: $9.87 (This is lower than the current price, indicating some analysts believe it is currently overvalued based on their targets.)
High Estimate: $20.00
Low Estimate: $3.00
Recent News & Outlook:
SoFi recently reported strong Q1 2025 results, with revenue growing 20% year-over-year. While net income decreased 19% year-over-year, it was still significantly ahead of guidance.
The company is focused on expanding its financial product offerings and has seen strong growth in its user base.
Some analysts suggest that SoFi is establishing itself as a leader in the evolving digital banking landscape and could benefit from long-term trends as more young people transition into adulthood and begin their banking journey.
There are some potential concerns about economic issues and the elevated default risk associated with higher-risk loans compared to more established banks.
Recent news indicates SoFi's crypto plans now include stablecoins.
Important Note: Stock analysis involves inherent risks and predictions can be volatile. It's always recommended to conduct your own thorough research and consult with a financial advisor before making any investment decisions.

SOFI Long Setup – 2.83 Risk/RewardSOFI looks ready for a breakout. The price is consolidating just above the cloud after reclaiming the Kijun line. This setup offers solid upside if momentum follows through.
Entry: ~$13.46
Target: $16.37 (21.6% upside)
Stop: $12.43 (7.65% downside)
Risk/Reward: 2.83
Why I like this trade:
Clear support above the cloud and Kijun line
Strong recovery from April lows with higher lows forming
Tight risk with a decent breakout target
Ichimoku showing early signs of bullish trend resumption
I’m watching for volume to confirm and a daily close above $13.70 for conviction. Worth tracking if the macro backdrop holds up.
Let me know if you're in or staying on the sidelines.
#SOFI #Stocks #TradingSetup #Ichimoku #Breakout #RiskReward #SwingTrade #TradingView

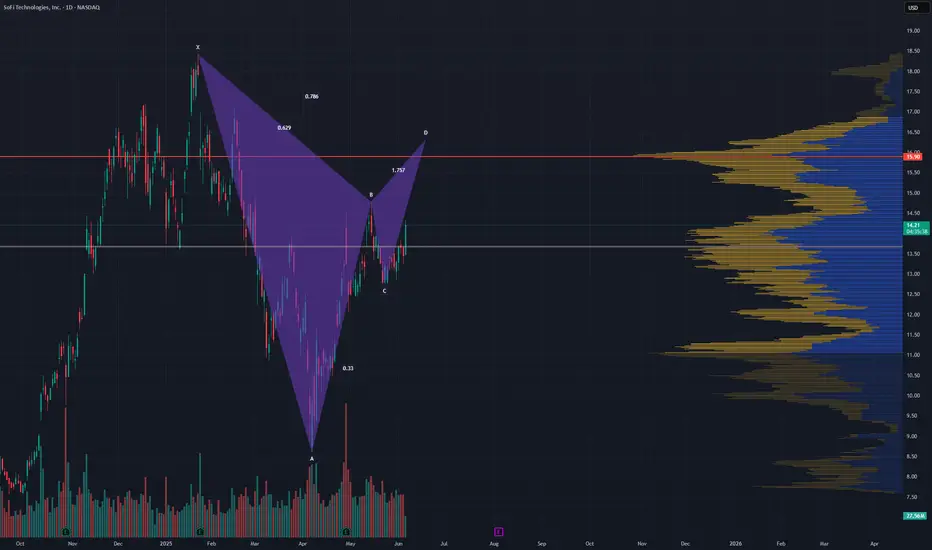
$SOFI looks like its forming a bearish Gartley Noticed this potential #Gartley #Harmonic on #SOFI the other day. I hope my 14c calls do get blessed with its completion.
I expect a retrace to 13.30 then 11.55 of the completion.
SoFi Technologies (SOFI, 1D)On the daily chart, SoFi has broken out of its descending trendline, confirmed the breakout with a clean retest of the 0.618 Fibonacci retracement level at $12.33, and is now building upward momentum from this demand zone. This “buy zone” is acting as a launchpad for a potential mid-term move toward higher resistance levels.
Key Fibonacci-based upside targets:
– $13.48 (0.5 retracement)
– $14.64 (0.382 retracement)
– $16.07 (0.236 retracement) — within the defined target zone
– Extended target: $18.37 (1.0 Fibonacci projection)
Technical structure highlights:
– Breakout of multi-month downtrend + successful retest
– Price now trading above key EMAs (50/100/200)
– Volume expansion on bullish candles confirms demand
– Daily momentum favors further continuation toward the $14–$16 zone
– Premium supply zone above $16 may slow initial momentum but offers long-term potential toward $18+
Fundamental context:
SoFi is evolving as a vertically integrated fintech platform with strong brand recognition and growing user engagement across banking, investing, and lending services. As the company narrows losses and strengthens recurring revenue, investor interest in SOFI is growing — particularly as market appetite returns for high-quality fintech with path-to-profitability models.
The technical breakout is confirmed. As long as price remains above the $12.33–$12.50 buy zone, the bullish scenario remains valid with targets toward $14.64 and $16.07. A breakout above $16 would activate the full expansion toward $18.37 in the mid-term.

SOFI Long TradePreferred entry here or lower on market open
TP1 14.85
TP2 15.45
Feel free to let partial open after

Another Key AreaPrice has returned to the 100 EMA at 14.01; will the Bulls have their way and pass 14.40 price and fill up the gap and test the 14.80 price area? Or will the Bears short away to the 200 EMA at 13.60?

SOFI short idea, call me crazy but this is what I see, ElliotPer Elliot wave analysis, we are looking for Wave C in correction pattern.

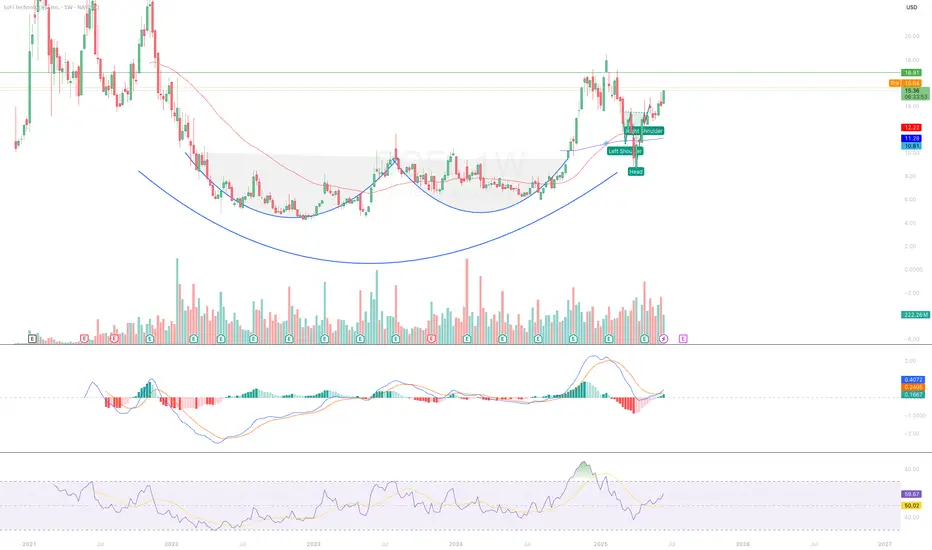
Inverted H & SLeft Shoulder: Formed in late February.
Head: Created in March at the lowest point.
Right Shoulder: Recently completed in early June.
Neckline Breakout: The price is now testing or breaking above the neckline (~$15), which is typically a bullish breakout signal.
