1SQ trade ideas


SQ update2 black arrows show the demand/supply zone for SQ
If the black line is broken and below I'd buy puts right before close. If we're above the line I'd buy calls. Both trades have a 50% risk because this is a CRITICAL demand/supply zone so it can work either way
GLTA and happy holidays!!!
What to expect next?
- CRSP due diligence
- RIOT long-term price target
- ACB run-down

SQ Play The MoveMarkets seems to have rotated to the safer haven stocks today, such as FAANGs and blue chips. SQ, a consistent producer for the year, could be in a much needed pullback or retracement as a result. RSI trend has snapped but is still in bull zone.
Key support levels to watch are the 220, 214 and 200. Must have confirmation first, though. Purple box for ideal reversal area.


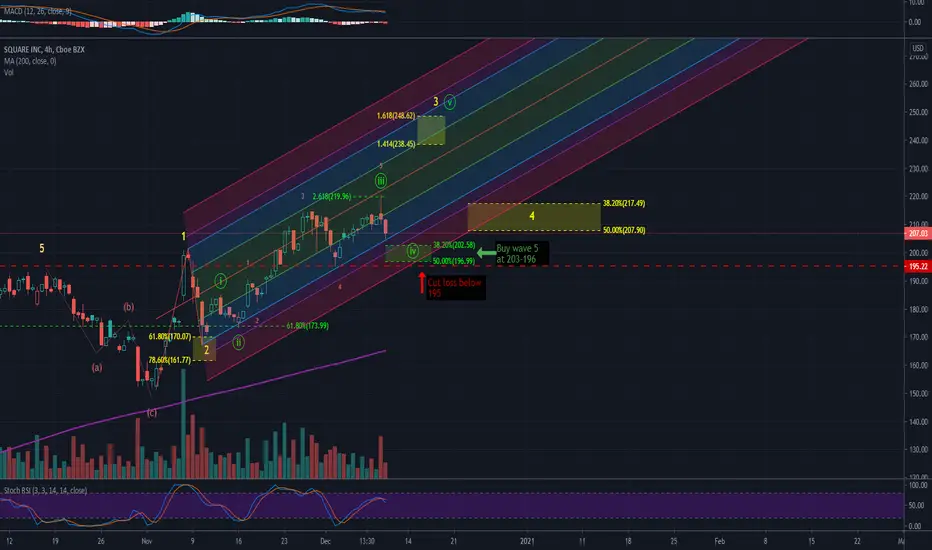
$SQ Wave #5 Long$SQ Update from my last week’s chart. Wave #2 Bounced of nicely from the 61.80% retracement. Wave #4 right on 38.20% retracement of Wave #3. Can be a really solid run up to Wave #5 if it bounces off the support right now.


SQ Rising Wedge - Bullish on old trend lineSQ
12/20/20 755pm pst
Rising Wedge- reversal incoming.
SQ will return to the strong upper trend from the March low point. It has only broken this Trend Line once. Allow SQ to run and come back. I see the entry at early January. SQ has no good/bad news, just a strong company. The stock will drop slowly at same cyclical slope.
One of the many stocks we're all wishing we bought and held, I'm sure.

Strong support at 200 RNNeed no further explanation. On rise from several months. In clear uptrend making regular higher highs and higher lows.

SQ Look to keep going up, but risk of a short-term pullback.Looking for a good buying opportunity in the near future.

#SQ $SQ Textbook shooting star formingLooks like a shooting star forming on daily candles, after what appears to be an ending 12345 diagonal. Seems like a fair time to be buying SQ puts. I grabbed Jan 15th 210s, if they profit tomorrow, I would probably close out, if the stock goes up, but does not break the top of the shooting star candle, I would add a little bit. Stop at the top of the shooting star. This is not financial advice, merely a punter's opinion.

SQ 1D Acending WedgeAcending Wedge, narrowing between trendlines.
Likely to breakout downside.
RSI divergence
MACD - no conformation yet, but might tip-off soon.
193-195: Potential target range in ~2 weeks.
Let me know what you think.

SQ updateNot really much of an update, but still going strong!
My EOY price target was $222 and I'm thinking we might see $228 now. Only issue I'm having is that the isn't volume picking up as seen on the OBV, a new ATH could be suspect with out it. I'll be keeping an eye out for a move up to $225 on a large volume spike, if not I think we'll play around 210-221 for the next little while

OPTIONS PLAY OF THE YEAR ($SQ)No matter how you trade, this stock has been in Beast Mode all year long!!!


SQ Looking to DropSquare has gone to the top of the higher trend line as well as a Fibonacci Retracement which has been extended to match key levels. Looking to retrace down to 177 and possibly 150.

SQ Topped OutSQ is at the top of my Fibonacci level, looking to see it retrace down to 178 and possibly 151.

$SE to $240 short term - EW and Pitchfork Analysis$SE is almost finished consolidating to the 38.2% level (around 203-202), which would make it bounce off the 1.25 pitchfork band (purple line). Since Stoch RSI is still falling, it may continue to drop to the 50% retracement level (around 197), coinciding with the 1.75 pitchfork band (red line). Furthermore this level is also the support from the Dec 2 low.
From here, i expect $SE to bounce to complete Wave 5 (green) which will complete Wave 3 (yellow) at the 1.618 Fib extension (from 238 and 248), confined between the upper 0.5 and 1 bands of the pitchfork.
This depends on the S&P500 continuing its uptrend to 4000 before a major pull back. If the S&P drops, expect $SE to drop with it .
SQ Moving Average (MA)NYSE:SQ
The moving average (MA) is a simple technical analysis tool that smooths out price data by creating a constantly updated average price. The average is taken over a specific period of time, like 10 days, 20 minutes, 30 weeks or any time period the trader chooses. There are advantages to using a moving average in your trading, as well as options on what type of moving average to use. Moving average strategies are also popular and can be tailored to any time frame, suiting both long-term investors and short-term traders.
