AT&T — Long $15 to 20Last orders:
1) buy 15,4
2) buy 15,9
3) buy 16
Long term purchase up to $20
- If the price does not rise, receive dividends and buy more.
Fix profit on 3 levels
- Sell 30% at $20
- Sell 30% for $24
- Sell 40% at $32
If the price goes up wildly, remove the TP and add SL at $24-$28.
Considering that the company pays dividends and if the price drops to $15, then you can buy more in the portfolio.
There are risks that there will be a crisis in the world in early August, so SL can be put on 50% of the capital. (at the moment transactions are in profit)
1T trade ideas

AT&T $T is the bottom in?AT&T fighting here to stay in the channel. Possible bounce here or if it fails we could go down into 10's.

$T -4%, are you serious?This is another case of hidden value by a downgrade.
Nothing we do today could be possible without this company; communication is the foundation of everything nowadays.
But technically we have a broadening falling wedge, the resistance is just 32% from this price.
Maybe the key day will be the earnings call, but the opportunity is there!
GL!
T: Support and resistanceT has been through a lot due to their Debt, let's see if it can get any relief or more grief.
This is a comprehensive support and resistance chart.
T might go lower and may not come back up for sometime. But looking at RSI it looks positive for next few months.

AT&T Bullish ReversalAfter a Black Crow threesome, T has been on a downtrend for 18 months. Potential bullish short term reversal.

AT&T Inc. (NYSE: T) Regains Investor ConfidenceInvestor Relief Amid Rumors: Investors in AT&T Inc. (T) recently experienced a sense of relief following a period of uncertainty, as the stock faced significant downward pressure, driven in part by rumours suggesting that Amazon (AMZN) planned to enter the wireless industry. Analysts advised investors not to panic, emphasizing that the stock may have reached a point of peak pessimism. This notion was further supported by the belief that the rumour could help "shake off the last of the weak holders."
Constructive Price Action: Over the past month, AT&T's price action has exhibited constructive behaviour, bolstering analyst confidence in the stock's bottoming process. This resilience indicates that the company's fundamentals remain intact and that the market sentiment may be stabilizing. Furthermore, management delivered a strong message during a June conference, explicitly stating that "there is nothing to the rumours that have been discussed." This statement likely helped assuage investor concerns regarding potential disruptions, leading to a more positive outlook.
Dividend Assurance: One significant aspect that strengthened AT&T's appeal to income investors was its recent declaration of a quarterly dividend of $0.2775 per share. This move debunked worries about a potential dividend cut and instilled greater confidence among investors. Moreover, AT&T maintained its $16 billion free cash flow (FCF) outlook for FY23, further reinforcing its ability to navigate the uncertain macroeconomic landscape in the second half of the year.
Improved Investor Confidence: The combination of reassuring statements from management, the company's commitment to its dividend, and the maintenance of its FCF outlook have collectively improved investor confidence in AT&T's prospects. These developments have likely countered the concerns that triggered weak holders to sell off their shares out of fear for the safety of their dividends.
Conclusion: AT&T Inc. (T) has experienced a resurgence in investor confidence despite facing rumours and uncertainties. The stock's constructive price action, management's strong message, and the assurance of the dividend have contributed to a more positive sentiment. Investors should continue to monitor AT&T's performance and management's ability to execute its strategic plans in order to make informed investment decisions.
This content is provided for general information purposes only and is not to be taken as investment advice nor as a recommendation for any security, investment strategy or investment account.

T - ChannelsT is within a large Weekly up channel and a smaller down channel on this daily chart.
I expect a strong reversal when the bottom of the up channel is tested. Continuation of the down channel on daily is expected until bottom is reached.

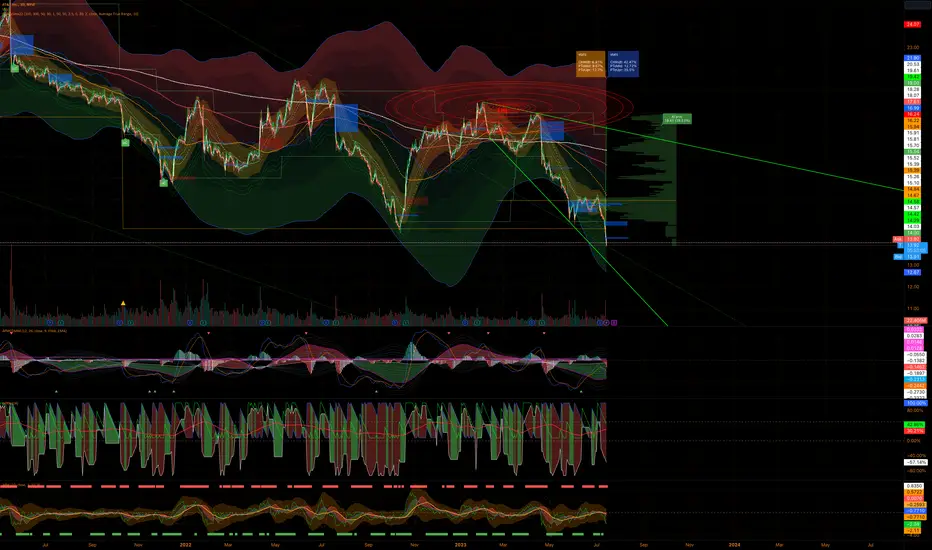
RSI divergence on all time frame for $TRSI divergence on all time frame for $T. Expecting a new bull run in the coming weeks.

COMMUNCATIONS LAGGARD RISING OFF OF WEEKLY DOUBLE BOTTOM AT&T has missed the entire communication's Bull Run and needs to catch up or at least rebalance higher. It's feeding off of the rotation into value and small cap stocks. It can start to break out fast without a retest if volume keeps rising.

Buying low hanging fruit!AT&T
A high option orderflow drew my attention to this stock.
One of the biggest and oldest companies in the communication services sector. At the moment on a multi year low.
I guess they will make it. And this price looks really inviting for a long.
Paying 1.11 dividend.
My anticipated technical target for the next 6-12 month is $17-18.
I'll take a shot.

AT&T nearing bottom Key Points
(+) AT&T continues to enjoy strong customer growth in a highly competitive market.
(+) Its revenue increased year over year in the first quarter, but free cash flow fell.
(+) Despite this, AT&T expects to hit its 2023 free-cash-flow target of $16 billion.
(-) Amazon Might Offer Mobile Service

AT&T LONGWe expect the price to hit the support levels and correct itself by going back up to the prior resistances levels.
We enter long at the support level
Entree at 14.49
Stop-loss at 14.10
Taking profit at 17

AT&T Breaking Support?It looks like AT&T is about to break support. Debt and old business ideas may be holding it back. Locally we just got high-speed fiber from T, so maybe it will turn around.

buyATT
BUY
SL 16.40
AT&T Inc. is an American multinational telecommunications holding company headquartered at Whitacre Tower in Downtown Dallas, Texas. It is the world's third largest telecommunications company by revenue and the third-largest provider of mobile telephone services in the U.S.

$T with a bearish outlook following its earnings #StocksThe PEAD projected a bearish outlook for NYSE:T after a negative under reaction following its earnings release placing the stock in drift D with an expected accuracy of 71.43%.

Watchlist 2023-04-21 $SPY $CSX $LVS $MGM $NWG $T $UALAMEX:SPY - opening up exactly at PD open, which is sort of strange. This whole week we have opened lower, trended higher, and then finished lower. This could mean there is a trend change today. However, Until the weekly downward trend is broken, I will assume we will continue it.
For further confirmation of a trend day, watch for:
USI:ADD pinned near +\-2000
USI:VOLD ratio over +/- 3
USI:TICK cumulating past 0 wicking to +/-900
NASDAQ:CSX - triple earnings beats, says it expects shipping prices to remain high in next quarter. Receives mutpile price target increases. However, we only have 1 PM RVOL , so will need to wait to see that number be raised before getting into a trade. There are not a lot of clear support levels we would have to use a 31.50 or 31.25 as confirmation. Target is 33.
NYSE:LVS - Swings to Profit in Q1 After Sales Surge, was very strong PD until Janet Yellen tanked that market with her comments. If we can see some support at 61, long is in play.
NYSE:T - terrible day PD, closing near the monthly pivot bottom of 17.50. If it stays weak, day 2 continuation short with a hold below this level. I do not want to be first to this trade, let the move happen and see it hold under this level as there is lots of risk that it can get bought up quickly. Else, there is a resistance test trade at 18 to start into a position anticipating a close below 17.50.
Other watches:
NYSE:NWG - no news but has RVOL of 2 right now and whipped out yesterday's gains will no retracement like many of the names that took a hit yesterday. Watching for weaknes off the open.
NASDAQ:UAL - strong day PD. Looking for a day 3 continuation short under 44.30

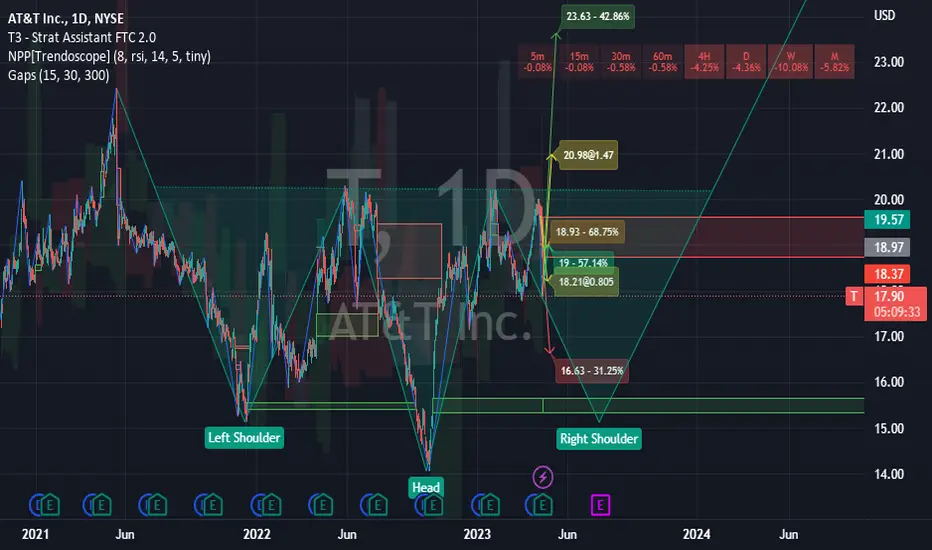
$T Daily chart inverse #head & shoulderNot financial advice.
A possible inverse head & shoulders.
right shoulder in the making, gap on the green area it aligns with left shoulder.
#like and #subscribe
Thanks!
Alex.
T AT&T Options Ahead of EarningsIf you haven`t sold T AT&T here:
Then analyzing the options chain of T AT&T prior to the earnings report this week, I would consider purchasing
Calls with a 20usd strike price and an expiration date of 2023-4-21, for a premium of approximately $0.38.
If these options prove to be profitable prior to the earnings release, I would sell at least half of them.
I am interested to hear your thoughts on this strategy.

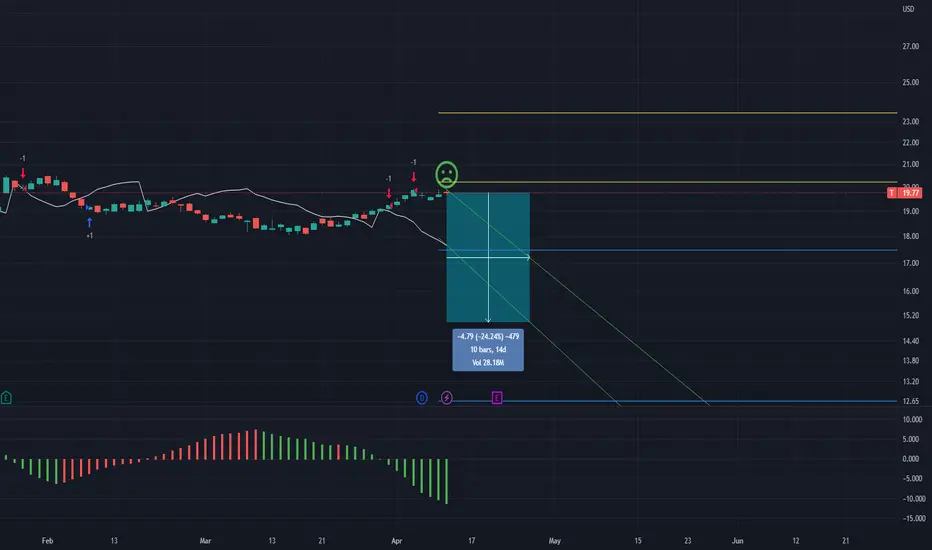
ATT, 10d+/-24.24%falling cycle -24.24% more than 10 days
==================================================================================================================================================================
This data is analyzed by robots. Analyze historical trends based on The Adam Theory of Markets (20 moving averages/60 moving averages/120 moving averages/240 moving averages) and estimate the trend in the next 10 days. The white line is the robot's expected price, and the upper and lower horizontal line stop loss and stop profit prices have no financial basis. The results are for reference only.
T (ATT). TF H1 LONGOn the hourly chart, the trend started on March 17 (linear regression channel).
There is a high probability of profit. Possible take profit level is 20.47
But do not forget about the SL = 18.01
Good luck!
Regards, WeBelieveInTrading

AT&T BUYAT&T stock has proven time and time again with jumps and false breakouts of implied volatility yet, posting a beta of about .67 and lots of upside potential it seems to be a valid time to purchase. Using the dividend discount model I was able to conclude that the cost of equity (COE) rounds out to be about 7.88% and a fair share cost price of $35.22 with an upside potential percentage of 88.12%. With only about 53% of the stock being held by large institutions and funds theres a lot of room for retail investors to purchase at&t at a hefty discount.

ATT probably not a bad place to buyQuarterly support down here. This stock is pain to own unless you're a dividend enjoyer. Not a bad place to add.

$T with a Bullish outlook following its earnings #Stocks The PEAD projected a Bullish outlook for $T after a Positive Under reaction following its earnings release placing the stock in drift A with an expected accuracy of 50%.
