TMUS at all times high for a long playTMUS - technology sector
Provides mobile communications services in the United States
It reported positive financial reports two months ago
Note that TMUS Is at all times high.
OBV supports the proposed direction
RSI is close to Overbought rate
You can wait for correction. Then a breakout of 74 level. After it'll become a support level, I'll check for long entry with a stoploss below 74
Worth a follow up.
This is not a recommendation to buy or sell.
1TMUS trade ideas

Beautiful Double Top at $TMUS TMUS formed a nice double top pattern at the daily chart
Enter a short around 70$
Stop loss at resistance level around 74$
Price target = Breakout point (70$) - Height of the pattern (Resistance - Breakout ~ 4$) = ~ 66$

T-Mobile $TMUS big weekly range breakout last week, activity in:T-Mobile working on getting its $26B merger with Sprint approved, and on 2-13 via OptionsHawk.com "1,600 December $62.50 puts sold to open today for $2.94"

TMobile on the moveWith current news in mind along with the need for RSI to reset, a move down about 5% is anticipated. from there we watch for support or another leg down totaling a near 13% drop

[TMUS] Phase 3, phase 2 or phase 1?This chart is complicated. The price is over 30MM. If you think in long-term, it's in phase 1 with an established resistant in $70.76.
I think it is in phase 1, otherwise, is in stage 3. If the price breaks the resistant, it will be in phase 2.


#TMUS another bull flag and break on weeklyAnother weekly bull flag break from TMUS. Looks bullish as of now. It needs to close at all time high this week or might retest the rising 5 week MA and consolidate there.

#TMUS another bull flag and break on weeklyAnother weekly bull flag break from TMUS. Looks bullish as of now. It needs to close at all time high this week or might retest the rising 5 week MA and consolidate there.

TMUS up trentline 15 min. : LONG TIME support and resistant !!tmus is in a up trent right now and it going on awhile is you look at the long term support and risistant.

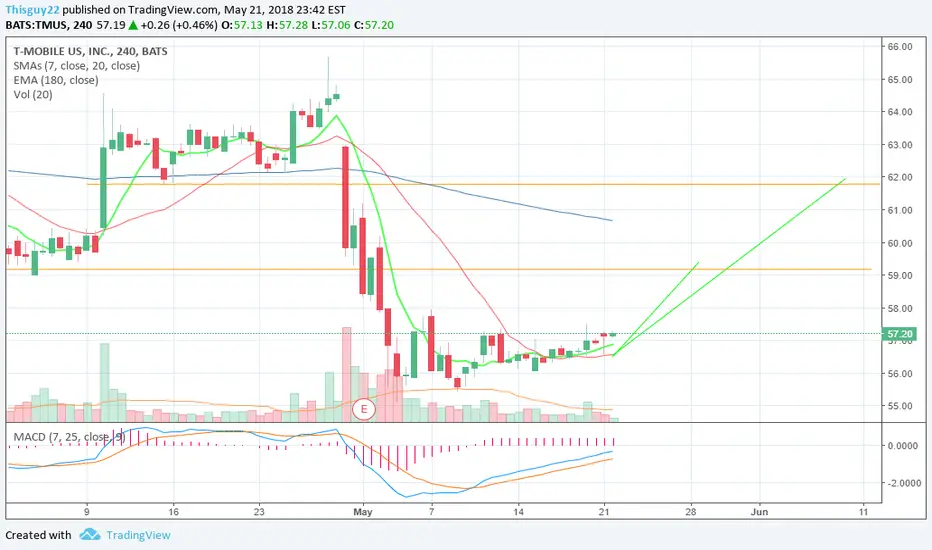
TMUS LONGTMUS long idea at this price range looks great.
Target above 60 USD with stop loss as per chart. Entry price can be around 57.50 to 58 USD
For Options, January 2019 and January 2020 looks great.
NASDAQ:TMUS

TMUS is near the top of the hill soon its gonna breaking down TMUS short term, support and resistant , trentline

TMUS Bollinger Bands has narrowed to near 6-month lows.
In trading on Thursday, shares of T-Mobile US Inc (Symbol: TMUS) entered into oversold territory, hitting an RSI reading of 29.3, after changing hands as low as $55.23 per share. By comparison, the current RSI reading of the S&P 500 ETF ( SPY ) is 51.9. A bullish investor could look at TMUS's 29.3 RSI reading today as a sign that the recent heavy selling is in the process of exhausting itself, and begin to look for entry point opportunities on the buy side.


TMUS on daily!I see the signal is getting strong on this one. Gains will be made 59 and maybe up to 61 oh yeah!

TMUS good entry Buy, higher all the way to Memorial Day Weekend This finds which have formed Cup-with-Handle patterns which are at least 8 weeks long and at most 9 months long. The beginning, or left side, of the cup, has to start after a rally of at least 30%.
Then a 20% to 30% correction from the old high (left side cup edge) must occur. The stock then builds a rounded base which slowly climbs back toward the old high The right edge of the cup must be at most 15% below the left edge (the old high). Then a slight pullback occurs which forms the handle.
The handle can be a minimum of 1 week long & max of 6 weeks in duration. It must also form within the top half of the cup and be within 15% of the left side top of the cup.
The official / traditional buy point is when & if the stock rises above the RIGHT edge of the cup on higher than average vo lume

T-Mobile [1d chart] - Hangin' at Support, Upside in a Neat RangeThere's a lot going on with T-Mobile lately.
Despite the Great 5G Debate, regulatory concerns, and a third-times-the-charm merger attempt with Sprint, T-Mobile is trading in a somewhat predictable, relatively established range.
Thank you in advance for your attention!
The fundamentals of the stock put it in a precarious spot with outside uncontrollable governmental and economic forces dictating the speculative sentiment of its price, but from a technical standpoint, TMUS is offering buyers a cheap entry point at the bottom of a short-term trading range that nicely corresponds with some more established, longer-term historic support zones.
T-Mobile might be at the bottom of a nice, neat range, but the price activity of the last few trading days may indicate a bear flag situation tracing out, which could presumably send the stock price down into the ~$51.50 USD area - but, with price already at historic support and the support of the recent trading range, traders can make a case for a bear flag not playing out at all in the next few days, and T-Mobile returning to recent highs of $65.00-$66.00 in the next couple weeks - or higher in the next couple months.
Please like, follow, and share, and maybe we can have fun and do great things together.
Thanks again!
See it on the site: holsturr.com/category/markets/charts/
** For speculative and research purposes only - good luck! **

Long on sprintAB=CD pattern on sprint looking long
T-Mobile agrees to acquire Sprint for $26 billion

T-Mobile US - Daily Price Action Analysis | Bat PatternThe TMUS price increased significantly last few days and it reached the resistance area at 65.14. The price respected that level few times already and it is more likely that it will do it again. Moreover, the price action formed the shooting start candlestick bar, which is considered as a reversal pattern. It means, there is a shift from buying to selling. The bears are going to sell sometime soon and it is the best area to do so.
In addition, TMUS formed a bat pattern, which increases the probability of this setup and provides the entry and exit points. Plus, nice risk/reward ratio.
T1- 38.2%
T2 – 61.8%
- Follow & Comment -

Bearish BatBearish Bat with bearish divergence. Momentum is slowly changing to the downside and this is a pretty extended bat pattern, so I don't mind that price shot through the potential reversal zone. If we can get price to stabilize in the zone, then this could be a nice option play.
Measurements
- .886XA
- 2.618BC
- 1.618AB=CD

Cup and Handle Pattern?We see a Cup and Handle pattern starting on the 10/30/17 selloff when they announced that the merger between NASDAQ:TMUS and NYSE:S was officially off after years of talk. Once price recovered and hit the $62s level again on 11/27/17, we see a slight decline, as people who bought in at that level were looking to get out. The price is finally back at the mid $62s finishing the Handle pattern. Will we see a breakout next week?

Can Something happened? This stock had some action yesterday. Today outside day and, ended in a green hammer and, now we are going to have a watch if this stock plays dead and, roll over or this support and, bounce. On the 60 it's just a mess. I'd expect that this would expand or possible pop up and, make something happened

