VKTX: Unusual Options Flow & a Breakthrough Weight-Loss DrugIf you haven`t bought CKTX before the recent rally:
Now you need to know that Viking Therapeutics (VKTX) is a speculative biotech stock in the GLP-1/GIP agonist space, aiming to challenge market leaders like Eli Lilly and Novo Nordisk. Recently, I noticed unusual options flow — specifically, Jan 1
Next report date
—
Report period
—
EPS estimate
—
Revenue estimate
—
−1.065 EUR
−106.22 M EUR
0.00 EUR
108.96 M
About Viking Therapeutics, Inc.
Sector
Industry
CEO
Brian Lian
Website
Headquarters
San Diego
Founded
2012
FIGI
BBG01TNXKZW2
Viking Therapeutics, Inc. is a clinical-stage biopharmaceutical company, which engages in the development of therapies for metabolic and endocrine disorders. The company was founded by Brian Lian and Michael A. Dinerman on September 24, 2012 and is headquartered in San Diego, CA.
Related stocks

Here come the VikingI’ve been watching this chart for a little while now. It’s been an absolute shipwreck. I remain neutral but it’s high on my watchlist. Watching for signs of strength, we are not quite there yet.
The chart reflects the lack of enthusiasm from investors, this company doesn’t generate revenue but are
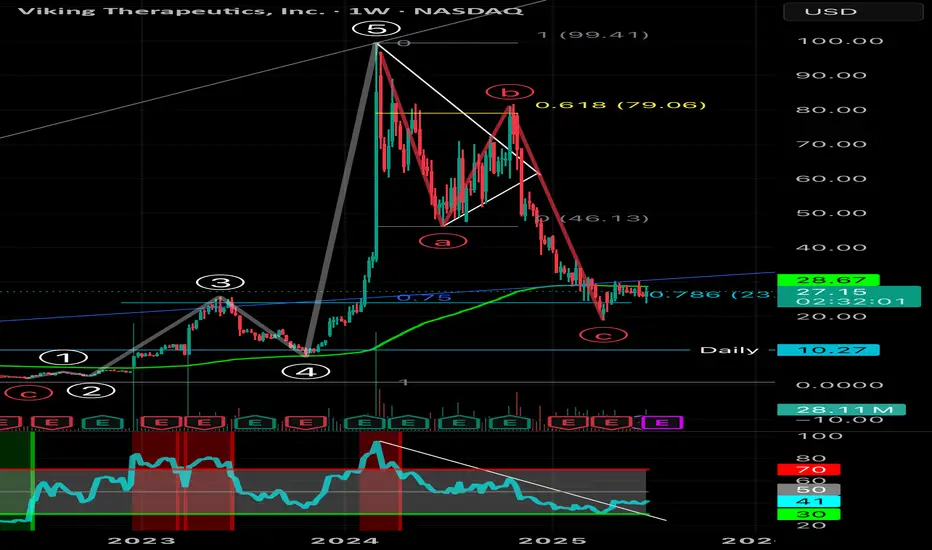

$VKTX Gann VKTX has a beautiful symmetry. Ones it breaks the next arc, it will gravitate to the next one!

$VKTX Trade Alert - 42% Upside🚨 NASDAQ:VKTX Trade Alert 🚨
☕️ CupnHandle Breakout:
🎯 $41.76
⏳ October 1st 2025
💸 Jan. 16th $30 Calls
Not Financial Advice

temporary bullish movementas of 1 hr frame, to give a bullish movement and then continue downward trend to green line then we would check for some price action

VKTX – 30-Min Long Trade Setup!📈 🟢
🔹 Asset: Viking Therapeutics, Inc. (VKTX – NASDAQ)
🔹 Timeframe: 30-Min Chart
🔹 Setup Type: Symmetrical Triangle Breakout + Retest
📊 Trade Plan – Long Position
✅ Entry Zone: $23.60 (Breakout confirmation above triangle resistance)
✅ Stop-Loss (SL): $22.50 (Below structure & trendline support)

VKTX – 15-Min Long Trade Setup!📈 🟢
🔹 Asset: Viking Therapeutics, Inc. (VKTX – NASDAQ)
🔹 Timeframe: 15-Min Chart
🔹 Setup Type: Symmetrical Triangle Breakout + Retest
📊 Trade Plan – Long Position
✅ Entry Zone: $22.21 (Breakout confirmation above yellow zone)
✅ Stop-Loss (SL): $21.38 (Below rising trendline + structural base)
🎯 Ta

VKTX: Support Levels to Watch A double bottom formed in early March, leading to a strong bounce above $30. Since then, the stock has pulled back into the mid-$20s. Given current market conditions and the chart setup, a retest of S-1 at $24.50 looks likely. If that level breaks, S-2 at $17.96 comes into play as the next key suppo

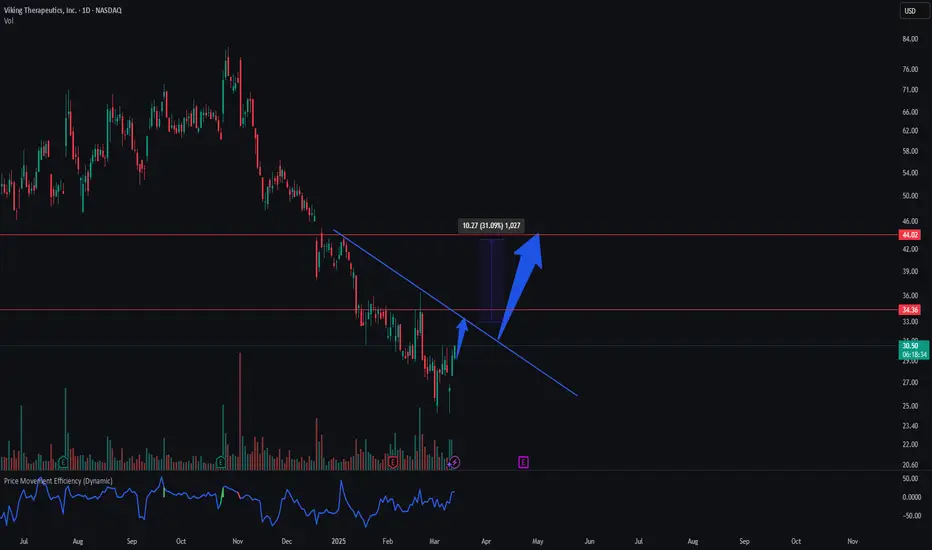
Viking Rejecting This Price LevelBefore testing the $30 region, Viking is likely to retest the descending trendline around $34. This move could represent a 10% gain in the short term.
If the descending trendline breaks, the next potential target would be $44, signaling a strong bullish continuation. Keep an eye on price action and
See all ideas
Summarizing what the indicators are suggesting.
Neutral
SellBuy
Strong sellStrong buy
Strong sellSellNeutralBuyStrong buy
Neutral
SellBuy
Strong sellStrong buy
Strong sellSellNeutralBuyStrong buy
Neutral
SellBuy
Strong sellStrong buy
Strong sellSellNeutralBuyStrong buy
An aggregate view of professional's ratings.
Neutral
SellBuy
Strong sellStrong buy
Strong sellSellNeutralBuyStrong buy
Neutral
SellBuy
Strong sellStrong buy
Strong sellSellNeutralBuyStrong buy
Neutral
SellBuy
Strong sellStrong buy
Strong sellSellNeutralBuyStrong buy
Displays a symbol's price movements over previous years to identify recurring trends.
Frequently Asked Questions
The current price of 1VKTX is 27.885 EUR — it has decreased by −0.41% in the past 24 hours. Watch VIKING THERAPEUTICS INC stock price performance more closely on the chart.
Depending on the exchange, the stock ticker may vary. For instance, on MIL exchange VIKING THERAPEUTICS INC stocks are traded under the ticker 1VKTX.
1VKTX stock has risen by 2.63% compared to the previous week, the month change is a 17.32% rise, over the last year VIKING THERAPEUTICS INC has showed a 23.00% increase.
We've gathered analysts' opinions on VIKING THERAPEUTICS INC future price: according to them, 1VKTX price has a max estimate of 106.64 EUR and a min estimate of 25.59 EUR. Watch 1VKTX chart and read a more detailed VIKING THERAPEUTICS INC stock forecast: see what analysts think of VIKING THERAPEUTICS INC and suggest that you do with its stocks.
1VKTX reached its all-time high on Jul 10, 2025 with the price of 26.440 EUR, and its all-time low was 21.200 EUR and was reached on Jun 23, 2025. View more price dynamics on 1VKTX chart.
See other stocks reaching their highest and lowest prices.
See other stocks reaching their highest and lowest prices.
1VKTX stock is 5.59% volatile and has beta coefficient of 1.31. Track VIKING THERAPEUTICS INC stock price on the chart and check out the list of the most volatile stocks — is VIKING THERAPEUTICS INC there?
Today VIKING THERAPEUTICS INC has the market capitalization of 3.05 B, it has increased by 1.68% over the last week.
Yes, you can track VIKING THERAPEUTICS INC financials in yearly and quarterly reports right on TradingView.
VIKING THERAPEUTICS INC is going to release the next earnings report on Jul 23, 2025. Keep track of upcoming events with our Earnings Calendar.
1VKTX earnings for the last quarter are −0.38 EUR per share, whereas the estimation was −0.30 EUR resulting in a −25.00% surprise. The estimated earnings for the next quarter are −0.38 EUR per share. See more details about VIKING THERAPEUTICS INC earnings.
VIKING THERAPEUTICS INC revenue for the last quarter amounts to 0.00 EUR, matching the estimated figure, and no changes in revenue are expected for the next quarter.
1VKTX net income for the last quarter is −42.18 M EUR, while the quarter before that showed −34.21 M EUR of net income which accounts for −23.28% change. Track more VIKING THERAPEUTICS INC financial stats to get the full picture.
No, 1VKTX doesn't pay any dividends to its shareholders. But don't worry, we've prepared a list of high-dividend stocks for you.
As of Jul 17, 2025, the company has 36 employees. See our rating of the largest employees — is VIKING THERAPEUTICS INC on this list?
Like other stocks, 1VKTX shares are traded on stock exchanges, e.g. Nasdaq, Nyse, Euronext, and the easiest way to buy them is through an online stock broker. To do this, you need to open an account and follow a broker's procedures, then start trading. You can trade VIKING THERAPEUTICS INC stock right from TradingView charts — choose your broker and connect to your account.