Woodward Breaks Out: $250 in Sight as Momentum Clears Multi-YearWoodward Inc. (WWD) just completed a textbook breakout from long-term resistance near $197, and the move is being confirmed with strong momentum, but near-term caution is warranted as RSI and MACD are both flashing extended conditions.
Technical Breakdown – WWD
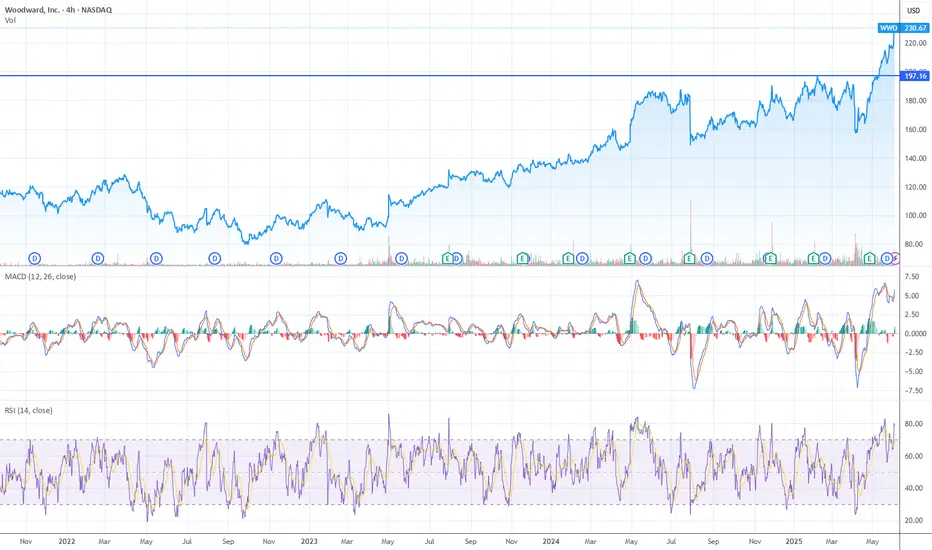
Price Action – Long-Term Breakout
Price has cleared a major multi-year resistance zone around $197, a level that capped the stock for years. This breakout is part of a strong uptrend, and there's little overhead resistance until psychological round numbers like $250+. The breakout has held and extended — suggesting institutional conviction and trend shift confirmation.
Let’s walk through the Fibonacci extension analysis on Woodward Inc. (WWD) to project logical upside targets from this long-term breakout.
Fibonacci Extension Setup
We’ll anchor the Fib extension to the most relevant long-term impulse wave:
Swing low: ~$85 (October 2022)
Swing high: ~$197 (December 2023 — major resistance level just broken)
Pullback low: ~$157 (Feb–Mar 2024)
This defines the first leg of the uptrend and gives us a base for projection.
$224 zone is where price currently sits — minor resistance.
$250 matches your psychological round number target and the 1.618 Fib extension — high-probability level to take profits or expect selling.
$280 is possible if the broader market stays bullish and industrial/defense names continue to lead.
Final Take:
WWD is in price discovery above long-term resistance — with $250 as the primary upside target and $280 as a stretch zone if momentum persists.
1WWD trade ideas
$WWD - technically move to the moonNASDAQ:WWD
Ticker :
$WWD (Woodwards)
Forecast :
Possible growth 44% from 98$ to 143$ in 4 months.
Does not constitute a recommendation.

$WWD a bullish outlook after earning release $WWD posted its earnings with a negative over reaction following its release with the PEAD projecting a bullish outlook placing the stock in Drift C
If you would like to see the Drift for another stock please message us. Also click on the Like Button if this was useful and follow us or join us.

WWD throught 98 ATH Love these bluesky break out opportunities.
going to base in around 97, take a full position through 98
vs 95 (94.89)

