XOM - Bottom of Right Shoulder Inverse Head and Shoulders potential with current position, bottoming of right shoulder.
Good spot for pilot or add to take advantage of a coming impulse wave higher. Current target: 145.
1XOM trade ideas

XOM 110 C Exp 2/14/25 (Swing setup)Showing head and shoulders pattern on higher and lower time frames amidst market news that has been trending lately about tariffs. Swinging throughout the week and will check back in later this week.

$XOM with a neutral outlook following its earnings #StocksThe PEAD projected a neutral outlook for NYSE:XOM after a positive over reaction following its earnings release placing the stock in drift B with an expected accuracy of 37.5%.

XOM Approaching Resistance! Will It Break Out?Technical Analysis (TA)
Current Market Structure:
* Price Action: XOM has rebounded strongly from the $108 support level, forming an ascending trendline while approaching a key resistance near $111.10 - $112.00.
* Trendlines: There’s a breakout attempt from a wedge pattern, indicating a possible continuation toward higher levels if sustained buying pressure persists.
Indicators:
* MACD: Showing a bullish momentum with a positive histogram, but the signal line is slightly flattening—watch for a potential crossover indicating trend continuation or weakness.
* Stochastic RSI: Overbought (above 90), signaling possible short-term consolidation or a minor pullback before continuation.
Support & Resistance Levels:
* Immediate Resistance: $111.10 - $112.00 (Key breakout zone)
* Major Resistance: $115.00 (Psychological level + call walls from GEX)
* Support Levels: $109.71 (trendline support), $108.00 (critical support zone)
Gamma Exposure (GEX) & Options Flow
Key Insights from GEX:
* Bullish Gamma Walls:
* $115.00 – Strongest Call Resistance Zone → If breached, expect a gamma squeeze pushing prices higher.
* $112.00 – Second Call Wall (53.98% probability of hitting)
* $110.00 – Holding as a pivot zone; breaking this level with volume could confirm further upside.
* Bearish Put Walls:
* $108.00 – Put Support Zone → If the price falls below, downside risk increases.
* $105.00 & $100.00 – Major Put Walls, meaning strong downside hedging activity.
IV & Options Sentiment:
* Implied Volatility (IVR 21.2, IVX Avg 22.5) – Moderate volatility, indicating a balanced risk.
* Put Activity: PUTS at 36.8%, meaning downside hedging is still active.
* Call Activity: Moderate bullish positioning, suggesting controlled upside with resistance at $112 - $115.
📊 Trade Setups & My Suggestions
Bullish Scenario:
* Entry: Above $111.10 (Confirmation of strength)
* Target 1: $112.50
* Target 2: $115.00 (If gamma squeeze triggers)
* Stop Loss: Below $109.50
Bearish Scenario (Failure to Break Resistance):
* Entry: Below $110.00 (Breakdown confirmation)
* Target 1: $108.00
* Target 2: $105.00
* Stop Loss: Above $111.50
Final Thoughts
* XOM is at a critical breakout zone near $111.10.
* Bullish continuation is likely if we break $112, targeting $115.
* Failure to hold above $110 could lead to a pullback toward $108.
* Options data suggests heavy resistance at $112 & $115, but if breached, a gamma squeeze could fuel rapid upside momentum.
⚠️ Disclaimer:
This analysis is for educational purposes only and does not constitute financial advice. Always do your own research and manage risk before making any trading decisions.

EXXONMOBIL ($XOM) EARNINGS & OUTLOOKEXXONMOBIL ( NYSE:XOM ) EARNINGS & OUTLOOK
1/7
ExxonMobil is back in the spotlight after Q4 2024 earnings. ⚡️💰
From a $59.5B Pioneer merger to record Permian production, there’s plenty to unpack. Let’s dig in!
2/7 – Q4 & FULL-YEAR EARNINGS
• 2024 earnings: $33.7B, down from $36.0B in 2023
• Q4 2024: $7.6B net income (~$1.72/share), with $12.2B in operating cash flow
• Distributed $36B to shareholders in 2024—talk about rewarding loyalty! 💸💥
3/7 – EXPANSION & STRATEGY
• Targeting higher output in Permian Basin & Guyana, despite oil oversupply
• FWB:20B annual share-repurchase program planned for 2025
• Recent Pioneer merger boosts upstream portfolio—long-term production potential just got a big upgrade 🚀
4/7 – VALUATION VS PEERS
• P/E ratio ~13–14, below the industry range (15–18) ✅
• Dividend yield ~3.5%, beating the 3.0% sector average
• Stacks up against Chevron ( NYSE:CVX ) & Shell ( NYSE:SHEL )—but ExxonMobil’s Guyana assets could be the real differentiator 🌍⛽️
5/7 – RISK FACTORS
1️⃣ Oil oversupply + OPEC+ cuts → Price uncertainty 📉
2️⃣ Global economic slowdown → Softens demand
3️⃣ Regulatory scrutiny → Heightened costs
4️⃣ Shifting to renewables → Could reduce big-oil momentum
6/7 Is ExxonMobil truly undervalued given its strong cash flow & dividend?
1️⃣ Yes – Undervalued gem
2️⃣ No – Oil oversupply risk is too high
3️⃣ Maybe – Need more clarity on renewables
Vote below! 🗳️👇
7/7 – SWOT SUMMARY
• Strengths: Advantaged assets (Permian/Guyana), robust cash flow 🏭
• Weaknesses: Reliance on oil price, smaller renewables exposure
• Opportunities: Pioneer merger, carbon capture, high-value chemical products
• Threats: Regulatory, oversupply, economic slowdown

XOM - preparation for great earnings!Hi guys we would be looking at XOM, just before their earnings! Let's take a look into the fundamentals
Robust Financial Performance
Exxon Mobil has demonstrated resilience with consistent earnings growth and strong cash flow generation, even amidst fluctuating energy prices. The company’s disciplined capital allocation strategy and cost-management initiatives have positioned it well to maximize shareholder returns.
Dividend Stability and Yield
XOM remains a top choice for income-focused investors, maintaining its status as a Dividend Aristocrat. The company’s strong dividend history reflects its commitment to rewarding shareholders, which further enhances investor confidence.
Favorable Market Conditions
Global energy demand remains on an upward trajectory, fueled by economic recovery and industrial activity. Exxon Mobil's diversified portfolio across oil, natural gas, and chemical sectors allows it to capitalize on these trends, while its focus on high-margin projects strengthens profitability.
Strategic Investments in Growth
Exxon Mobil’s ongoing investments in key growth areas, such as Guyana's offshore assets, low-carbon technologies, and LNG production, position it for long-term growth. These projects are expected to generate substantial returns and bolster the company’s competitive edge in the energy sector.
Positive Analyst Sentiment
Many analysts have revised their price targets for XOM upwards, citing its strong fundamentals, operational efficiency, and capacity to adapt to evolving energy trends. This bullish sentiment reflects the broader market's optimism regarding Exxon Mobil's prospects.
Energy Transition Opportunities
While maintaining its core oil and gas operations, Exxon Mobil has also been actively investing in carbon capture and storage (CCS) technologies and other low-emission energy solutions. These initiatives align with global sustainability goals and offer new revenue streams for the company.
Technicals are written on the chart we are sitting on the upper support block which gives us an indication that we would move into the resistance level which is where our target is going to be situated
Entry: 110
Target: 123.50

XOM calls 115 area1/21 XOM tested the 115 area however when market open we consolidated in the 111-112 area. 110 has became support and we have inside candles on 4hr, daily weekly and monthly. I’m looking to catch a reversal back into the 120-122 area if we can hit out first point of 115.91. XOM does have earnings soon and we could continue to see increase volume and bullish moment push into the stock. With time on contract I would pick March honestly we can see XOM break out to upside.

Downward for Exxon Mobil. XOMPicture is highly suggestive of an Elliott downward impulse, with wave 5 remaining. Momentum is certainly building, indicators are about to turn.
The narrow price action in the most recent candles are highly suspect for a wave 4 in the undergoing impulse. Fibtime is not excluding the possibility of Wave 5 yet.
We are not in the business of getting every prediction right, no one ever does and that is not the aim of the game. The Fibonacci targets are highlighted in green or purple with invalidation in red. Confirmation level, where relevant, is a pink dotted, finite line.
Fibonacci goals, it is prudent to suggest, are nothing more than mere fractally evident and therefore statistically likely levels that the market will go to. Having said that, the market will always do what it wants and always has a mind of its own. Therefore, none of this is financial advice, so do your own research and rely only on your own analysis.
Professionally, we are big fans of any indicators from Jurik, De Mark and Ehlers, which we use in addendum in analysis prior to putting down positions.
We prefer a combination of at least four technical factors to favor a particular stance. A stance is never decided by this constellation, rather the constellation merely confirms the stance.
Trading is a true one man sport. No single confluence of indicators is truly good enough, and a professional trader's sense must be developed through a lot of hard work and over a significant period of time. Good luck out there and stay safe.

Exxon Mobil Corporation (XOM) - Technical Analysis and OutlookThe Exxon Mobil Corporation (XOM) chart on the 1D timeframe is showcasing a potential bullish setup. Here's a breakdown of the technical factors influencing the stock price and possible scenarios to watch for in the coming sessions:
Chart Overview
Trendline Support: The stock is bouncing off a strong ascending trendline that has been respected since late 2023. This upward sloping support has historically provided solid price rebounds, reinforcing its significance as a key technical level.
Recent Price Action: After a corrective phase, XOM has reversed from its recent low near $105, forming higher lows on the way up. The price has moved above $108.75, suggesting early signs of a bullish continuation.
Targets and Key Levels
Immediate Resistance | Target 1: $114.20 | The first target aligns with a previous horizontal resistance zone. This level also corresponds to a key pivot from the past corrective movement.
Higher Resistance | Target 2: $120.45 | The second target is near $121.45, representing the previous major high and a potential challenge for the bulls.
Support Levels: The first major support is at $106, coinciding with the ascending trendline.A break below this level could signal further downside, with the next support near $100.00.
⚠️ Disclaimer: This analysis is for informational purposes only and does not constitute financial advice. Always perform your own research and consult with a professional before making any investment decisions.

XOM Bullish Reversal : Targeting 109-110 Exxon Mobil (XOM) is holding steady around the $106-$107 support level, with strong trading activity in this range suggesting it could be building momentum for a move toward the $109-$110 resistance zone. The high volume at these levels shows solid interest, which could support an upward breakout if buyers step in. However, if it fails to break above $109-$110, there’s a risk it could drop back to test support. Overall, the current setup looks promising for a push higher, as long as the right conditions align.
Goal:109 2.67% short term

$XOM Long Entry - Sector Strength & AI SupportTradespoon model generated long signal for Exxon Mobil NYSE:XOM with 60% probability to stay above $107.13 today. Predicted range: $107.13–$109.44. Estimated change: +0.90%. NYSE:XOM

EXXON MOBIL Will it recover the devastating December?Exxon Mobil (XOM) gave us an excellent buy signal on our last idea (September 27 2024, see chart below) as it quickly hit our $120 Target:
Since the November 22 2024 (Lower) High though, it had an aggressive sell-of that stopped on the December 20 2024 Low. The price has stabilized for now but hasn't yet gained the necessary momentum to stage a rebound.
On the other hand, there are some very encouraging signals that justify going long as the Risk/ Reward Ratio has turned very favorable for buying. The price might not be exactly at the bottom (Higher Lows trend-line) of the Channel Up but the 1W RSI is on the 38.35 Support, which is the exact level where the it bottomed on January 19 2024, on the previous Higher Low.
At the same time, the 1D MACD has completed a Bullish Cross, which has always been a solid buy entry below the 0.0 level. As a result, even though the stock may deliver one last pull-back to test the bottom of the 14-month Channel Up, it is worth buying now as the upside is significantly higher. Our Target is the Resistance 2 level at $126.40.
-------------------------------------------------------------------------------
** Please LIKE 👍, FOLLOW ✅, SHARE 🙌 and COMMENT ✍ if you enjoy this idea! Also share your ideas and charts in the comments section below! This is best way to keep it relevant, support us, keep the content here free and allow the idea to reach as many people as possible. **
-------------------------------------------------------------------------------
💸💸💸💸💸💸
👇 👇 👇 👇 👇 👇

Exxon Long Play2/6/24: New Demand Zone reached. Feb '24 reached a new higher-high, which either gives sustained price above $102 and continues up (Plan A), or price falls further into demand testing $95 and adding positions along the way, reducing cost average. $95 would be the bulls last chance at breaking out of the $116-120 Supply Zone.

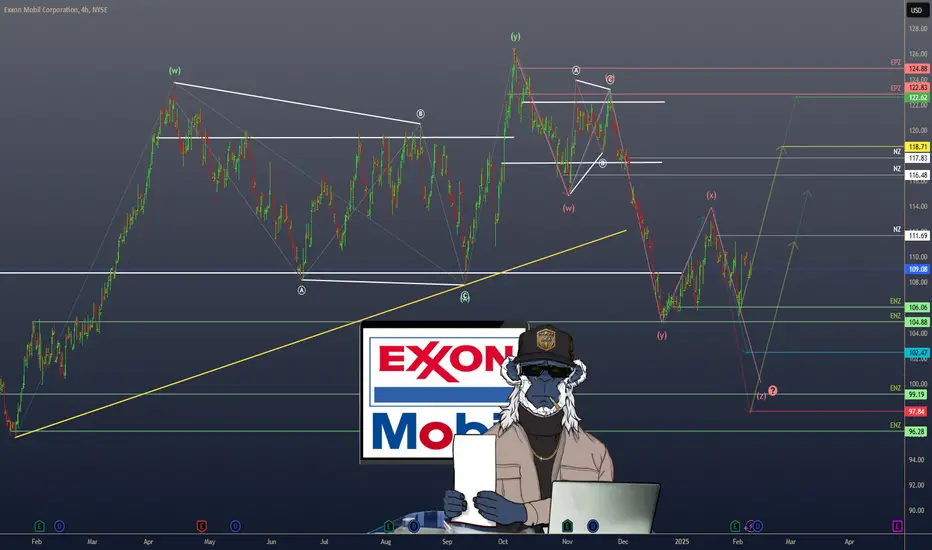
Exxon Mobil (XOM): Preparing for a Q1 2025 SetupHeading into Q1 2025, we believe NYSE:XOM could present a promising buying opportunity, and we are preparing a setup to align with our bias. Since April, we have been closely monitoring Exxon Mobil, and the technical picture continues to gain clarity as the stock respects both the range middle and range high. The wave ((b)) overshot wave A by a significant margin but still within acceptable limits for a flat correction.
Since the overshoot in early October, NYSE:XOM has seen a substantial decline—falling 17% over 75 days, a significant move for this stock. The primary driver behind this decline seems to be ongoing shareholder challenges. Over the last three years, Exxon Mobil has resisted calls for meaningful carbon emissions reductions, instead doubling down on traditional oil and gas operations. Legal action against shareholder activists pushing for emissions reduction targets has only added to the controversy, with proposed changes falling short of expectations.
The shareholder concerns highlight a critical point: some voting patterns defy logic when aligned with long-term goals. Questions remain about whether Exxon Mobil should, or can, prepare for a carbon-neutral future. The widely publicized shareholder vote in 2021, which many hoped would lead to substantial changes, seems to have produced minimal practical outcomes.
Despite these issues, we see potential for NYSE:XOM to resolve its challenges in the near future. From a technical standpoint, we observe a strong likelihood of a wave C drop into the $101–$92 range, which aligns with the 61.8%–78.6% Fibonacci retracement levels. This would be a key area to begin building a position.

XOM to 108My trading plan is very simple.
I buy or sell when price tags the top or bottom of parallel channels.
I confirm when price hits Fibonacci levels.
So...
Here's why I'm picking this symbol to do the thing.
Price at bottom of channels (period 100 52 39 & 26)
Stochastic Momentum Index (SMI) at oversold level
VBSM is negative and at bottom of Bollinger Band
Price at or near 3.618 Fibonacci level
Entry at $105
Target is $108 or channel top

Crucial Moment for XOMThere was a substantial up-trend since Oct. 2020. This trend ended at about $100. Price increased to $127 but has since fallen to $106. There was resistance at $105 in 2014 and this is a key level again. Price is currently $106 and $105 is support. This is a crucial moment the stock given there is not a well-defined up-trend now, and price is so close to support. Also, volume has been decreasing during the up-trend since 2020 which indicates the trend is losing pressure to maintain it. Going long now is o.k., but a stop should be used at $104 which is just below support. If price falls below $105, the stock can be shorted down to support at $95. See three highlighted areas. This is a 10% drop from $106. This is not investment advice.

Really nice Bounce coming for XOMThis NYSE:XOM chart is looking really solid for a potential bounce! Here’s why:
Strong Support:
The price has pulled back to a key area near the 50% and 61.8% Fibonacci retracement levels. These levels often act as a strong base for a reversal.
Trendline Holding:
There’s a long-term upward trendline right under the current price, adding extra support.
Oversold Indicators:
The Stochastic Oscillator is deeply oversold, meaning it could be ready to turn up.
The RSI is showing bullish divergence – the price made lower lows, but the RSI made higher lows. That’s often a great sign of a potential reversal.
Momentum Shifting:
The MACD is still negative, but it looks like it’s starting to lose steam. A crossover could be on the way.
Potential Play:
If this holds, we could see a bounce back to $113-$116 in the short term. Watch this one closely, and as always, have a stop-loss plan in case it breaks below support.
This setup looks like a great opportunity to me. What do you think?

$XOM Trade Analysis DarkPoolsKey Observations:
Descending Wedge Pattern:
The chart shows a descending wedge, marked by a narrowing price range between the green support line and red resistance line. This is a bullish reversal pattern.
Price is currently testing the upper red resistance trendline, signaling a potential breakout.
Dark Pool Levels:
Key levels include:
111.76 (BA SW).
110.82 and 109.12 acting as potential support or resistance zones based on price action.
These levels suggest significant institutional activity, making them critical for trade planning.
Support and Resistance:
Support levels:
The wedge's lower green trendline near 106.28.
Major dark pool support at 104 (BB SW 104).
Resistance levels:
108.07 (Dark Pool Level).
111.76 and 112.00 (Dark Pool and Fibonacci target).
Higher targets at 115.00, 117.50, and 120.00 (Fibonacci extensions).
Trend Analysis:
The price is currently near the 8 EMA and 21 EMA, suggesting consolidation and potential for a breakout.
A break above 108.07 (dark pool level) could trigger bullish momentum.
Trade Idea:
Entry:
Breakout Entry: Enter above 108.07 if confirmed with strong volume.
Pullback Entry: Enter near 106.28, the lower wedge support, for a better risk-to-reward ratio.
Profit Targets:
112.00: First target aligning with Fibonacci and dark pool levels.
115.00: Second target, key Fibonacci extension.
117.50: Third target based on continued bullish momentum.
120.00: Final target for a strong bullish move.
Stop Loss:
Close below 106.00: Invalidates the wedge pattern breakout.
Close below 104.00: Signals bearish continuation, as the price would break significant support.
Risk Management:
Ensure position size aligns with risk tolerance.
Risk-to-reward ratio should be at least 1:3, considering entry at 108.07, stop loss at 106.00, and initial target at 112.00.
Additional Notes:
Volume Confirmation: Look for above-average volume on breakout above the wedge's resistance line.
Dark Pool Reaction: Monitor price action near dark pool levels (especially 108.07 and 111.76) for reversals or breakouts.
Fibonacci Levels: Higher Fibonacci extensions suggest strong potential upside if the breakout is sustained.

Exxon Mobil corp setting for a bigger correctionHello,
Exxon Mobil Corp engages in the exploration, development, and distribution of oil, gas, and petroleum products. It operates through the following segments: Upstream, Downstream and Chemical. The Upstream segment produces crude oil and natural gas.
TECHNICAL ANALYSIS- Checklist
Structure drawing (Trend line drawing on past price chart data)- As shown below
Patterns identification (Naming patterns on past price chart data for future wave)- The price is a corrective pattern. Expanding triangle
Future indication (Reading indicator for future wave)- 0 crossover on MACD. Breakout on the corrective wave could confirm further upside
Future wave (Drawing on future price chart using future indication from indicator)- As shown
Future reversal point (Identifying trend reversal point on price chart using structure)- Target price $126 for exit (no buy opportunity from current price)
Next earnings report date: Jan 31st 2025
Market capitalization: 528.77 Billion
ExxonMobil financial performance for the first nine months of 2024:
Total Revenue and other income at 266.159 billion nine months ended 30th September 2024
Year-to-date earnings were $26.1 billion versus $28.4 billion in the same period last year
Net Income including non-controlling interests at $27.1 Billion, a decrease of $2.2 billion from the prior year period.
Cash and cash equivalents $26.9 billion versus $31.5 Billion in the same period last year
Total liabilities at 185.5 billion versus $163.8Billion in the same period last year
ExxonMobil plans to continue its strategic focus on high-return projects and operational efficiencies, with an anticipated investment level of approximately $28 billion in 2024. The company aims to advance its low carbon business plans, including carbon capture, biofuel production, and other emission reduction initiatives.
Acquisition of Pioneer Natural Resources: Completed on May 3, 2024, this acquisition is expected to bolster upstream production capabilities, particularly in the Permian Basin.
www.tradingview.com
Challenges and Risks
Market Risks: Price fluctuations in crude oil and natural gas, industry refining margins, and chemical margins.
Operational Risks: Integration of the Pioneer acquisition, volume growth and production challenges, and higher expenses from increased depreciation and maintenance activities.
Regulatory Risks: Tax-related items, government mandates, and changes in sustainable production levels due to government-imposed production limits or sanctions.
Emerging Risks: Supply chain disruptions, environmental regulations, and future policies and technological advancements related to emissions reduction and sustainability.
Management’s Strategies: Focus on strategic projects and high-value products, structural cost savings, and prioritizing investments in high-return projects while maintaining a strong balance sheet and consistent shareholder returns.
Our Recommendation
Exxon Mobil remains fundamentally strong with a robust balance sheet, but its stock appears overstretched, presenting some risk. The company’s stock has been trading in a sideways range since February 2023 to date. In October 2024, the company traded at a 52-week high of 126.34, a gain of over 30% just in the year 2024. While a Trump presidency could influence the oil industry, fluctuations in oil prices typically have a more significant impact on oil company stocks. Recently ExxonMobil CEO Darren Woods was quoted to saying “I don’t think the level of production in the U.S. is being constrained by external restrictions,”. He added: “I’m not sure how ‘drill, baby, drill’ translates into policy.”
Given the current price of $120.31, we do not see an immediate buying opportunity. Instead, we recommend exiting around the all-time high of $126.34, as a larger correction in the stock seems likely.
President-elect Donald Trump said that oil and gas industry executive Chris Wright would be his pick to lead the Department of Energy. Wright is the founder and CEO of Liberty Energy. He is a defender of fossil fuel use and is expected to support Trump's plan to maximize production of oil and gas.
Good luck & best of luck.

Exxon is oversold (the most since 2020)NYSE:XOM is inside it's sideways channel since March 2024 and trades within a price range of $108 - $123 with one failed breakout to the upper side in October.
The recent pulldown came from commodity prices (oil) and political drama about how much oil will be offered in Trump's term. Of course, it would be best if supply will not outpace demand too much since this would let oil prices drop. Trump will learn this soon enough. Because of that it's mostly noise what we have seen in this chart.
The level at $108 offered strong support twice and the sector (XLE) is also offering support itself. Also, the last time we've seen this stock so oversold was during the Covid crash in 2020.
From a fundamental perspective, Exxon Mobil's recent performance highlights its strong investment potential. The company's total shareholder yield, combining dividends and buybacks, now exceeds 7%, offering substantial returns to investors. In Q3 2024, Exxon reported $8.6 billion in net profit, with a 25% production increase, partly due to the acquisition of Pioneer Natural Resources. Despite a 5% earnings decline from lower commodity prices, Exxon's diversified operations and strategic investments in alternative energy position it well for long-term growth. The recent stock price dip presents an attractive entry point for investors seeking robust returns in the energy sector.
Target Zones
$114.00
$123.00
Support Zones
$108.00

$xomNYSE:XOM putting in a potential reversal doji here in this demand zone, high spike of selling may indicate capitulation. Would give this name plenty of time to move if looking at calls

XomWe need not to break the area. There is a possible upward trend that will rise and exceed the area above and make a new top.
