$XOM Strong buy at $30 With SPX 2850if the spx can hit 2850 which it can xom should be around 30/31 and a great buy - not advice
1XOM trade ideas


EXXON Mobil Corporation is bullish!!!I see some bullish signals on daily and 4h chart for EXXON Mobil Corporation.
Here is my trading plan for Exxon:
There is a gap around 35 so first of all, i expect this gap to be filled then i will aim 36.23 and 36.50.
Stop loss:33.70.
Have a nice day,
Berk.

XOM HASNT BEEN AT THESE LEVELS SINCE 20022002 was the first spiderman movie. I cant figure out the wave pattern (complex correction of sorts) for this chart but, at 31 - 32 levels I am def a BUYER. low risk, high reward.

XOM still bearish, needs to find bottom/consolidateNo clear direction on XOM, still downward moves. Technicals also not looking the best, negative divergence could signify that it still has room to drop. Copyright Rohan Karunaratne 2020


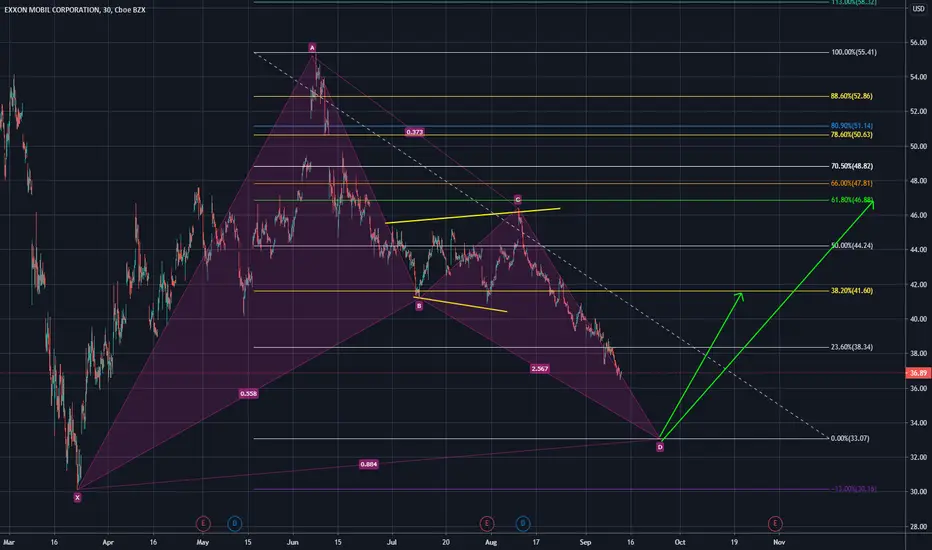
VALUE_BULLISH BUTTERFLYThe X-B is off a little, should be at .786. It's @ .764. But it's a monthly over 10 years.
I don't think this has a chance of playing out with unless their business model changes, but over another 10 years, maybe.

LONG XOMExpecting bounce from extremely oversold weekly and daily levels. If stop breached, be prepared to catch new daily reversal on lower levels with a tight stop.


XOM - 1D - ReviewXOM is currently sitting in the support zone after the crash.
I usually trade under these conditions when there is a MACD or RSI divergence, but I could not find any. Hands-off longs.
I will be verifying in the future about possible short positions.

Xom is as cheap as it will beYou can see the most oil stocks are starting to climb. Even though there’s a push for a lot of electric vehicles and I’ll take a good 5 to 10 years for at least a third of the market to adopt.

$XOM paying only 10% dividendcompleted a 73.46 correction and ready to move higher. XOM wont cut their dividend imo and the price cant stay low forever. people will be leaving the nasdaq soon enough and will want to park money somewhere. this is the kind of parking lot they will use.

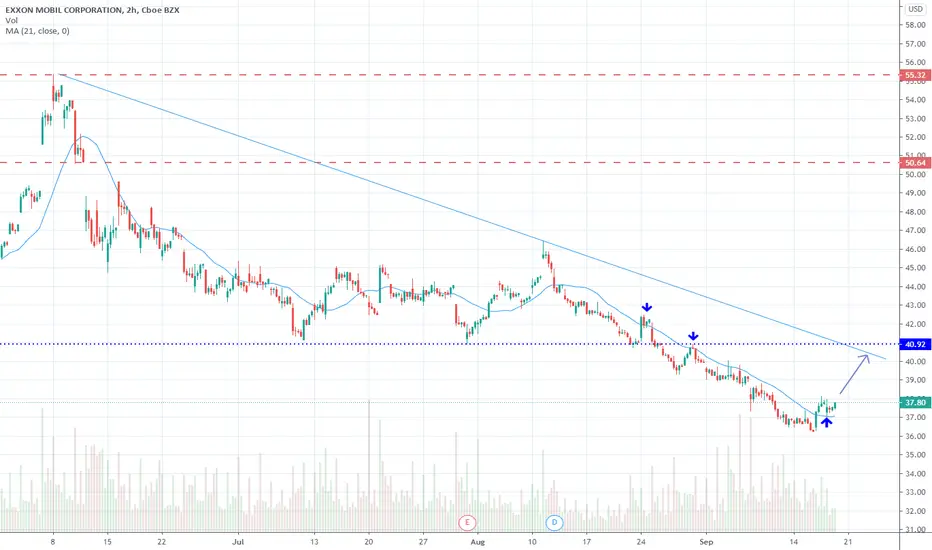
$XOM Starting off a low baseExxon recently broke through the 21MA and retested that break level again. Looking at some possible upside to $40 to challenge the downtrend. Small position against trend.

LONG XOMExpecting bounce from extremely oversold weekly and daily levels. If stop breached, be prepared to catch new daily reversal on lower levels with a tight stop.


ExxonMobil :You ain't betting against the Rockefellers,are you ?You ain't betting against the Rockefeller's company, are you ?
Nice bounce off the 61.8 Fibonacci retracement . Send it !

daily analysis of EXXON MOBIL CORPORATIONHi friends
the daily chart of this market shows that it will experience with a high probability a downward trend in the coming days but at the same time you have to be vigilant of the change from the direction to the opposite
please subscribe to receive more analysis
thank you
