Z - time to go zzz....Z has had a nice run up. More than doubled from $23 bucks. Huge red candle today on heavy volume.
I think this one is due for a pull back.
Position: Short 200 shares @ $50 today.
1ZGU trade ideas

Zillow 50% Fib CrossZillow closed at $42.46 on Friday for a -$1.50(-3.41%) loss. Price also closed back below the 50% Fibonacci level which was briefly breached to the upside last week but failed to hold as support going into the weekend. The 50% Fibonacci level acted as resistance back in March and April highlighted by the red arrows and appears to still be resistance now. Price needs to hold above the orange trendline in order for the short-term uptrend off of the March low to be sustained. Should the orange trendline fail to hold as support, the next level to watch for price to potentially hold at is the 38.2% Fibonacci level at $37.82. A move below that level would put price back in the purple shaded area of the total Fibonacci range which is the bearish end of the Fib levels.
The Relative Strength Index(RSI) is in a short-term decline with the green RSI line trending down, but remains above the centerline at 50. Above 50 indicates short-term bullish momentum, below 50 indicates bearish momentum. The purple RSI signal line is below the 50 level which indicates that the intermediate-term momentum never turned bullish. The green RSI line crossing below the purple signal line would be a bearish cross and indicate bearish momentum.
The Price Percent Oscillator(PPO) shows the green PPO line and purple signal line rising above the 0 level which indicates short-term bullish momentum. Above 0 is bullish, below 0 is bearish. The green PPO line trending above the purple signal line, and both lines trending up indicates bullish momentum.
The ADX shows the green +DI line above the purple -DI line which indicates a positive price trend, but the two lines look ready to cross which would indicate a shift to a bearish trend behind price. The histogram in the background indicates trend strength, which recently has all been small green bars that are trending relatively flat. Histogram bars rising indicates increasing trend strength while declining histogram bars indicate weakening trend strength.
Volume is relatively low during the recent price advance, and in the overall move higher off of the selloff low volume has been decreasing which is a bearish indication. In general, you want to see rising volume in an uptrend.
Overall, price is following the broader market for the most part with a current inability to hold above the 50% Fibonacci level. The trend, momentum and volume indicators below the chart are showing weakness as of Friday’s close. If price can manage to hold above the orange trend line the current uptrend will still have legs. Should price fall below the orange trendline and 38.2% Fibonacci level you can expect a new bear trend to be in play. Current stop-loss for longs should be placed just below the orange trend line, or the 38.2% Fibonacci level. Current view is neutral; bullish if price holds above the orange trendline; bearish if price breaks below the orange trendline.

$Z Strong Long Channel For $13.12 (31%) GainStrong upside trend and broke 46.38 at yesterdays opening, but closed down within normal range suggesting a false signal, and that the resistance remains. RSI suggests a temporary sell pressure. ADX buying pressure is accumulating, but is likely dependant on earnings when declared 29/04. Within the next two trading days price likely to come down to around $40 to meet support line, then rebound towards 46.38 again to finalise consolidation triangle.
Boundaries
If upward channel broken, two breakaway gaps and one runaway gap at 33.10 form a weak support. Prices could progress downwards to 20 in worst case.
Strong resistance at 46.38 and intrinsic value set at about 55.29 (slightly lower than absolute peak).
Risk / Reward
Possible long gain if bought now (42.17) set at around $13.12 (31%)
Possible long loss if bought now (42.17) estimated at. $9.07 (21%)

W5T Roller Coaster Smart List for Stocks in actionShowing a Roller Coaster Smart List alert for Zillow on Friday. Took off today. This new Smart List finds long & short trading opportunities for stocks & ETF's with a trailing stop to help manage it after it takes off. Check it out!


Zillow bull-case idea!Since its all-time-high on 2/2/2020 at $66; which was reached due to a 12% jump from earnings... ZG has fallen 50%
As we have seen in the past few volatile weeks, some stocks have outperformed due to the idea they will benefit from the COVID.
For example:
People buying masks, hand sanitizer (CLX)
People are staying home to work (ZM)
People are staying home streaming (NFLX)
People are stocking up on durables, non-perishables (COST, WMT, PG, CPB)
Pharmaceuticals are producing cures/vaccines/diagnostic tests (CODX, GILD)
With interest rates as low as they have ever been; housing is becoming very cheap, allowing people to buy more, and more expensive houses.
With the latest trend of staying home, plus people wanting to buy homes. I believe Zillow (ZG) could be a gainer.
--> Set tight limits, as negative momentum has been killing the bulls.
Rest up this weekend, happy trading!

Z For a quick bounce!Hi. Z looks good for a quick move I think from 51.75 to 53.90. Daily falling wedge action under the monthly with strong higher timeframes!


Zillow Group Trade setup
Earnings approach and expectations are high for a possible breakout
Possible entry level $52.75
Target price $60.00
Stop loss $50.00
Strong momentum and heavily shorted at 25%
Zillow Ready to RecoverZillow is down ~45% from this years peak, and almost back to the December 2018 dip. Recently, the SMA21 has been a rejection point; but price seems to be stabilizing and getting squeezed by that SMA21. RSI is increasing for bullish divergence, volume has a slight uptick. So could be ready to move up.
Placing stop under current support.
Price target 1) 0.236 FIB 2) S&R as shown in the blue circles 3) Near SMA50 for
For 15% gain R/R 4x

ZG – Bearish Entry to Gap Fill DownWaiting to enter position on Monday
Note – ZG earnings are on 2/10/2020.
I apologize for the Bitcoin video earlier today. Microphone issues. Issue will be fixed by Tuesday with mic. :)
Trade Entry
1. Short stock (not my preference)
2. Bearish Call Credit Spread – Collect premium for options that expire worthless.
A. Jan 17 expiry - 40/45 Call Credit Spread - $3.65 Credit or more received.
Max loss $135. Max gain $365 (credit received).
B. Feb 21 expiry - 40/45 Call Credit Spread - $3.10 Credit or more received.
Max loss $178. Max gain $307 (credit received)
Chart Details
Price hit resistance inside current wedge pattern.
Should head down to fill gap at $34 with support at $29.
Daily trend bearish. Weekly trend about to turn bearish.
Bearish EMA cross on Daily at $43.16.
One we get bearish EMA cross and 10WeekMA cross at $40, downtrend will be confirmed.
About Me
Thank you for liking, commenting, throwing up a chart, following, or viewing.
I am not a financial advisor. My comments and reviews are based on what I do with my personal accounts.
I am transitioning to my new website www.moneypatterns.com and have updated my name previously jbird7839. Same guy - new name. :)
Website will be ready for launch mid-January 2020. Thank you for your patience while I try to juggle everything and maintain the same standards.
Disclosure - I am long BTCUSD, GBTC. Short term GDX Bullish, SPXS Bullish

$ZG Gap Fill Trade in Zillow GroupEntry level $46.00 = Target price $49.40 = Stop loss $45.25
Bullish momentum, Golden cross complete on 1 day chart.
Short interest 6.42%.
Company profile
Zillow Group, Inc. engages in the provision of real estate and home-related information marketplaces on mobile and the web. The company operates through the following segments: Internet, Media & Technology (IMT), Homes and Mortgages segment. The IMT segment includes premier agent, rentals and new construction marketplaces, as well as dotloop, display and other advertising and business software solutions. The Homes segment includes Zillow Group's buying and selling of homes directly. The Mortgages segment includes advertising sold to mortgage lenders and other mortgage professionals, mortgage originations through MLOA and the sale of mortgages on the secondary market, as well as Mortech mortgage software solutions. The company was founded by Richard N. Barton and Lloyd D. Frink on July 25, 2014 and is headquartered in Seattle, WA.

ZG - Gap FillingZG is on a tear to fill the gap. I expect this to happen shortly and then for it to back and fill this huge move. Good for short term trade and working on long term thesis. RSI and MACD look tired so better long term price point probably lies below.

Let it cool off before re-entryToo difficult to predict at this moment, let the boll bands cool off before another entry point

Volume gaining momentum and still risingVolume gaining momentum and still rising
Volume is decreasing
Yet Price action has still been increasing
Shows light resistance at a critical historical resistance level around $41. If this breaks, this could easily go to $45

zillow still long this trade has been paying just want to updateThe trend is still intact and we has a breakout on the 15 min chart friday i will look for another entry monday, i have taken profits and let the RSI settle down 2x and reentered on the breakouts since my last post on this ticker. each move has been good for a couple bucks a share if you timed things correctly. I'm not sure if anyone is following these trades but we're batting about 80% to date and thats not too shabby. thanks for the likes and follows. theres no monetary gain that comes with any of that for me but i definitely appreciate the support so thank you for that. This is not financial advice just an observation.


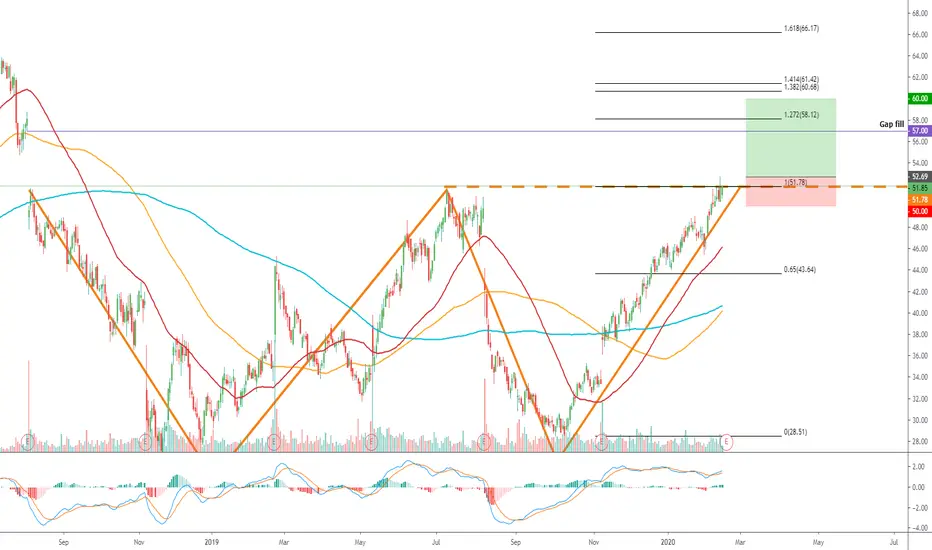
200 Day Moving Average Broke. ZG uptrend to begin4th Elliot Wave Retracement / Pattern Hold until another move upward

zillow long i will likely add to a half position at the first pullback if theres continuation here today. lots of strength, solid earnings, and a unique business model and product in the real estate sector
resistance at 40.00 upside potential 20%+
this is not a recommendation just an observation for educational purposes only.
give me a like and a follow

Zillow Looking for this 4 wave to finish if not already to buy 6-12 month expiration puts on the last 5 wave of the C (i like to pay for longer expirations if im going with the trend to give me enough time if trade goes against for a period of time). Would be able to
count 5 impulse waves down for the final 5 wave of the C. waiting for 1 wave down then 2 wave to not go above start of 1 wave
that would be my stop loss. Entry on 2 wave, for now waiting and watching.

