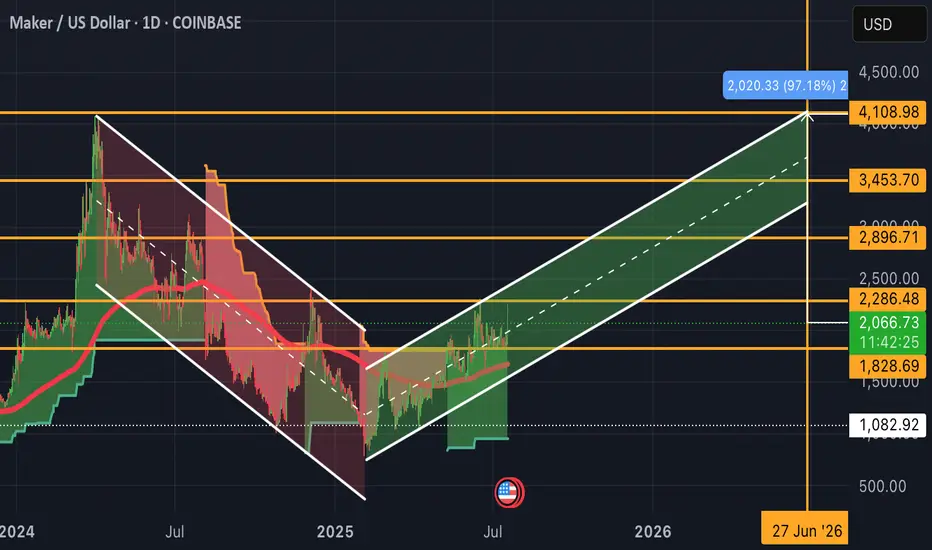
MKR-Setup for a Macro Bullish play, might take a year or soonerMacro Swing in play already. Literally give it a year to soak...or sooner.
200MA on the Daily is strong and reliable
Been Green SuperTrend and positive 200MA all of July.
SKY Token Transition: MakerDAO’s rebrand to Sky Protocol and the ongoing 1 MKR → 24,000 SKY conversion could tighten MKR supply as 43% of tokens remain unconverted. Staking SKY for 17% USDS rewards may incentivize long-term holding.
FRAX Integration: Plans to expand cross-protocol liquidity via Frax Finance could boost DAI demand, indirectly supporting MKR’s utility.
Real-World Asset (RWA) Collateral: MakerDAO’s $1B investment into tokenized loans via Grove Protocol diversifies revenue streams, potentially stabilizing MKR’s burn-mint equilibrium.
MKRUSD trade ideas
MKR - Following the channel, Target hit Respecting the ascending parallel channel...for now. Not a bad idea to take profits.
MKR’s rally combines exchange-driven FOMO around its SKY migration, whale-driven liquidity shifts, and technical momentum. Watch for sustained volume above $200M (current: $207M) to confirm continuation, or profit-taking near $2,300 (161.8% Fib extension). Will the SKY transition sustain demand post-swap, or trigger a “sell the news” reversal?

MKR - @ $1800 support, monitor closely for bullish correction BTC dominance up, Alts down including MKR.
MACD getting stronger, histogram looking better on 4 hour TF
RSI coming up off low 30's
Volume stabilizing
You can see the ascending price channel for secondary support and resistance
Next bullish wave should bring back to top gold Resistance line and above to top parallel white line.

MKR - Target hit for a 65%+ gainTook just 65 days for our target to execute for a 65%+ gain with peak selling near 80% gain.
Totally worth the wait.
Hope all is well. Took a few months off from posting here. I should be around more.
Have A Plan and Stick To It

Potentially a good time for LONG MKR/USDHello everyone, let's look at the 1W MKR to USD chart, in this situation we can see how the price created a lower low with the last drop, what is important is that now it goes up creating a new higher local high. What's more, we can see how the ema cross 50 and 200 approached each other, but the price exiting upwards should maintain a long-term upward trend. We can also see how the whole thing is moving in a descending triangle, but an exit from the yellow downward trend line upwards can give a new strong upward movement.
Let's start by defining the goals for the near future that it has to deal with, and here you can see how the price bounced off the first target:
T1 = 1631 USD
T2 = 2159 USD
Т3 = 3015 USD
Т4 = 3607 USD
As for support or potential stop-loss when opening a long, we need to consider a strong support zone from $1028 to $542, with the level around $790 being key, as it is our last lower low in declines.
The RSI and STOCH indicators show an attempt to break out of the local downtrend lines upwards, which may also have a positive impact on the next price movement.

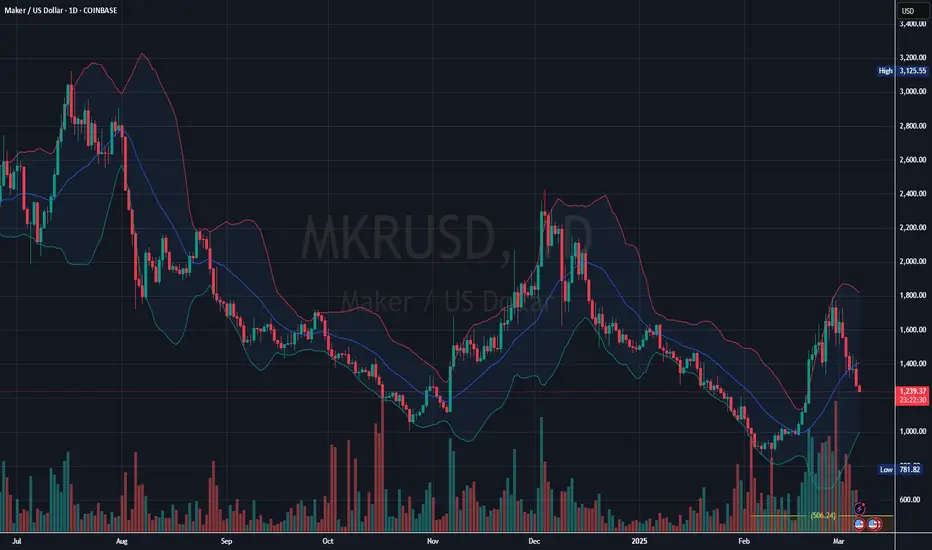
MKR/USD Bollinger Bands Analysis: Key Support & Resistance Level
Support: Around $1,100 (recent swing low).
Resistance: Around $1,400 (recent swing high).
If the price falls below the middle band, the lower band could act as support.
A drop below $1,100 could lead to further downside towards $900.

MKR Update-A bit shy of target, still a 66% gain exactly on timeWe got very close to plotted $1828 target by March 1st as the recent peak ended up maxing out at $1798 before March 1st, still a great 66% gain from original call out price of $1090.

Testing Key Support at $1,200
The price recently had a strong rally but is now in a short-term downtrend after failing to sustain highs near $1,900.
The price is currently below the middle Bollinger Band (moving average), signaling bearish momentum.
A potential support zone is around $1,200, near the lower Bollinger Band.
Widening Bollinger Bands indicate increased volatility.
The price is approaching the lower Bollinger Band, which could act as a support level.
Support: $1,200 (Lower Bollinger Band), $1,000 (Psychological Support)
Resistance: $1,400 (Middle Bollinger Band), $1,500 (Recent high before drop)
Bearish Continuation: If selling pressure increases and price breaks below $1,200, it may decline further to $1,000.
$MKR Market Update📊 CRYPTOCAP:MKR Market Update
Welcome to today's analysis! Let’s take a look at CRYPTOCAP:MKR and its key price action.
🌐 Overview: CRYPTOCAP:MKR Testing Key Resistance
📈 CRYPTOCAP:MKR is currently testing the red resistance zone. A breakout above this level could push the price toward the green line target.
🔄 Current Scenario:
CRYPTOCAP:MKR is facing strong resistance, and price action is testing this key level.
A successful breakout could lead to further upside, while rejection may result in a pullback.
🔑 Key Levels to Watch
🔴 Resistance Zone: Red Zone (Needs breakout for continuation)
🟢 First Target: Green Line (If breakout succeeds)
🛠️ Trade Scenarios
📌 Bullish Scenario (Breakout Above Resistance)
If CRYPTOCAP:MKR breaks and holds above the red resistance zone, it could move toward the green line target.
📌 Bearish Scenario (Rejection at Resistance)
If CRYPTOCAP:MKR fails to break out, we could see a pullback or consolidation before another attempt.
📌 Conclusion
CRYPTOCAP:MKR is at a crucial resistance zone—a breakout could lead to a strong rally, while failure to break may result in a retracement before another attempt.

Quick Thoughts on MakerCreated a channel between lows and highs on MKR
This allows for a large slanted W pattern to form if we expect the next high at the top of this channel plotted
Retest of ATH should come
Daily chart

MKR - 68% profit coming up...maybe before March 1stMacro setting up for another bullish wave to retest $1830 for a 68%+ gain maybe as early as March 1st.
RSI a bit high near mid 50, MACD looking more bullish.
Top take profit for a 100% Fib correction would be at EUROTLX:4K for an estimated 280% return!

MKRUSD: Channel Down bullish wave starting.Maker has just turned neutral on its 1D technical outlook (RSI = 46.979, MACD = -66.220, ADX = 40.770) as it hit the bottom of the 1 year Channel Down and bounced. The 1D RSI shows that we are on a similar rebound as on the October 25th 2024 bottom but needs to be validated by a crossing above the 1D MA50.
The two bullish waves before that have posted a price increase of +127.15%, so there is no reason to expect otherwise if the 1D MA50 is crossed. Be ready to go long (TP = 1,780).
## If you like our free content follow our profile to get more daily ideas. ##
## Comments and likes are greatly appreciated. ##

Lower Bollinger Band Signals Further Declines
The current trend shows consolidation after a prolonged bearish phase. The middle Bollinger Band could act as dynamic resistance or support, depending on the breakout direction.
Narrowing of the Bollinger Bands suggests lower volatility, often a precursor to a significant price move.
A break above $1,700 could confirm a bullish reversal.
A drop below $1,200 may signal continued bearish pressure.
A breakdown below the lower Bollinger Band could indicate further declines.
Target levels: $1,200, $1,000.

MKRUSD (1W) - buy the dipHi traders,
Here it is my idea for a long position on MKRUSD (1 week time frame).
The price hit a local high in July 2024 and hit another high in November 2024, meanwhile the price hit the SMA (in November 2024) that acted as a resistance and the price bounced back and is currently experiencing the pullback. The idea is to enter in the buy area, which is determined by a previous resistance zone that can be a support for a bounce up now. The buy area is between 1,732.57 and 1,368.88 .
We will put our first take profit at 2,891.86 where there was an high in July 2024 and the second take profit at 3,926.12 where there is the local high.
Good luck!

MKRUSD - Middle Gaussian Channel Line SupportBulls are completely in control right now as the middle line of this channel acts again as support. A support that led to a massive 1.5K% increase in 2020. Where do you guys think price will go to in 2025 / 2026 for this one?
Very bullish on this Monthly timeframe

MKR About to break big hereLooking for a #3000 target soon for MKRUSD.
Damn good price to be accumulating

Maker (MKR)Maker chart is interesting and odd at the same time. A rapid ascent followed by a slower correction that reached the bottom, making a big triangle form. MKR broke both the major and minor downtrend lines, and it seems posed for an upward impulse wave. Let's see what happens.

MKR-USDT 1W chart long-termHello everyone, what is the situation on MKR in the USDT pair, looking at the one-week time frame. We can see how the price formed a triangle from which we got a bottom exit.
Let's start by setting goals for the near future, which include:
T1 = $1664
T2 = $1982
T3 = $2,503
AND
T4 = $3,327
Looking the other way, you can see how the price remains at strong support at the level of $1,143, but if we go lower, there is still a very strong support zone from $668 to $449, which must help stop the price in the event of an even greater recovery.

Time to go long again Refer to my previous trade on this asset, linked below, which was traded to perfection. Time to go long again, keep stop loss under the weekly. Not financial advice!

Maker
The price has consistently made lower highs and lower lows, indicating sustained bearish momentum.
The bands are expanding, which indicates an increase in volatility.
There seems to be a 20-period moving average (middle line of the Bollinger Bands), which the price recently crossed below. This signals bearish momentum.
There are a few spikes in volume, particularly during the large price drops. This increase in volume during sell-offs suggests strong selling pressure.
Support: The nearest support is around $1,431.81, which is the lowest price visible in the chart. If the price breaks below this level, it may head towards lower support zones.
Bearish Bias: The price action, moving averages, and positioning near the lower Bollinger Band suggest a bearish trend.

Target 1K before the BIG RUNMakerDAO has broken the $1,762 support level, as shown clearly on the chart—a strong confirmation of the trend. I predict it could drop to $1,000 before beginning a new rally towards higher levels in early 2025.

Maker
The price is approaching the lower Bollinger Band, indicating potential oversold conditions. This could suggest a possible bounce or a continued downtrend if it breaks further below the lower band.
Resistance: There is strong resistance near the $1,800-$1,900 region, where the price had multiple rejections in late July and early August.
Support: Immediate support is around the $1,470-$1,500 region, which the price is currently testing. This level is crucial, as a break below could signal further downside toward $1,300-$1,400 levels.
The market has been in a consistent downtrend since mid-July, as seen with lower highs and lower lows. The price remains below the 20-day moving average (middle line of the Bollinger Bands), reinforcing bearish sentiment.
The volume appears to be slightly decreasing. Low volume during a downtrend could indicate weakening selling pressure. However, a spike in volume without a price reversal may signal a continued decline.
Bullish: If the price holds above the current support level ($1,470-$1,500), we could see a rebound toward the middle Bollinger Band (around $1,600) or even the upper Bollinger Band if the bullish momentum grows.
Bearish: If the price breaks below the lower Bollinger Band, a fall toward the next support zone ($1,300-$1,400) is likely, indicating further downside risk.
