MKR Harmonic Bat on Daily, LONG reversal MKR Harmonic Bat on Daily, LONG reversal . Targets on the chart.
MKRUSDT trade ideas

MakerDAO, trust meStrong FA, big things coming. Nothing specific to disclose yet. But watch for a move.

Long MKR⬆️Buy @ 2900 - 2700
✅TP1 @ 3130
✅TP2 @ 3400
✅TP3 @ 3700
✅TP4 @ 4000
✅TP5 @ 4600
✅TP6 @ 5250
✅TP7 @ 5800
⭕️SL @ 2600 ( D Close)


make sure you see this idea before sell your MAKERHello traders in this idea I wanna to show you one of the most popular DEFI coin ( MAKER) :
in this idea i want to talk about long term view of the MKR and also talk about the short term ; but first of all let's talk about the long term view :
for better understanding of the details i zoom out the daily chart to show you the long term view ;
you can see price already at weekly support and also near to the weekly trend line which is alignment with the 0.618 fib level ; so it's very hard for price to break it but maybe it's also possible to have shadow below it :
but you can clearly see price already in a giant triangle , so what price targets we can expect from the MAKER ?
as you the technical target of the triangle calculate in many ways but personally like to measures the targets by using the FIB levels :
i think it's very possible for the MAKER to reach at least the ATH but if the total market situations remains stable we can expect higher price target but the TAKE PROFIT area depends on your personal strategy . but I personally will sell 75% my MAKER at ATH and hold remaining 25% for higher price target because it's long term trade , you can puts your stop loss below the weekly trend line but i suggest to close your trade manually , because you must wait for the weekly close below it.
but let's talk about the short term ; here is 4H chart :
in the 4H chart you can see price tries to forming something like falling wedge but also it's very similar to the channel , but the important thing is that , as price dropping , volume started to decrease and also in the RSI created the upward channel so if your are looking for long position you can wait for the clear break out from the pattern and also retesting the 4h structure as support but it's depend on your strategy you can also buy some here .
I hope you enjoyed this analysis.
Do not forget to like and subscribe
share my ideas with your friends , thanks for watching my ideas

MKRUSDT by maintaining the current floor, one can expect the above goals by considering each of them as resistance


MKR - money MAKER once againInverted Head and Shoulders in the making with target $4270 (my interpretation). Let's make it, baby! 💰
Don't forget to check also the related ideas and my other analyses (link below). Cheers! 🥂
www.tradingview.com

MKRUSDT had a breakout from the descending channel 🦐MKRUSDT had a breakout from the descending channel 🦐.
If the price confirm the breakout, According to Plancton's strategy (check our Academy), we can set a nice order
–––––
Follow the Shrimp 🦐
Keep in mind.
🟣 Purple structure -> Monthly structure.
🔴 Red structure -> Weekly structure.
🔵 Blue structure -> Daily structure.
🟡 Yellow structure -> 4h structure.
⚫️ Black structure -> <4h structure.
Here is the Plancton0618 technical analysis, please comment below if you have any question.
The ENTRY in the market will be taken only if the condition of the Plancton0618 strategy will trigger.

🆓Maker (MKR) Aug-30 #MKR $MKRMKR is heading to the support area of $3200, this is a strong support area and can completely help MKR increase strongly in the near days to the areas of $4000, $4800 and $6400. But if it loses the $3200 area, then the $2800 area is the next strong support we need to pay attention to
📈BUY
🔴Buy : 3120-3280$. SL if B
🔴Buy : 3900-4100$ if A. SL if B
📉SELL
🔴Sell : 3900-4100$. SL if A
🔴Sell : 4700-4900$. SL if A
🔴Sell : 6300-6500$. SL if A
♻️BACK-UP
🔵Buy : 2730-2870$. SL if B
❓Details
📈Red Arrow : Main Direction as BUY and SELL section
📉Blue Arrow : Back-Up Direction as BACK-UP section
🟩Green zone : Support zone as BUY section
🟥Red zone : Resistance zone as SELL section
🅰️A : The Close price of 1-day candlestick is Above the zone
🅱️B : The Close price of 1-day candlestick is Below the zone

MKRUSDTPurchase order for MKRUSDT currency in time frame daily and it is better to use step purchase.

MKRUSDT is creating a descending channel 🦐MKRUSDT is creating a descending channel inside a daily ascending channel. If the price is going to have a breakout, According to Plancton's strategy (check our Academy ), we can set a nice order
–––––
Follow the Shrimp 🦐
Keep in mind.
🟣 Purple structure -> Monthly structure.
🔴 Red structure -> Weekly structure.
🔵 Blue structure -> Daily structure.
🟡 Yellow structure -> 4h structure.
⚫️ Black structure -> <4h structure.


MKR LongIt's pure price action and easy to understand.
Disclaimer: It's not a signal it's an idea open positions by your own responsibility.

MKRUSDTHello to you all. Mars Signals team wishes you high profits at all times.
We are in a 4-hour time frame. As you can see, we have drawn a support line for you dear ones, to which the price has reacted. Currently we have two price scenarios that we have shown you on the chart.
Warning: This is just a suggestion to you and we do not guarantee profits.
Wish you luck!
💡Don't miss the great buy opportunity in MKRUSD @MakerDAOTrading suggestion:
". There is a possibility of temporary retracement to the suggested support line (3485.14).
. if so, traders can set orders based on Price Action and expect to reach short-term targets."
Technical analysis:
. GBPJPY is in an uptrend, and the continuation of the uptrend is expected.
. The price is above the 21-Day WEMA, which acts as a dynamic support.
. The RSI is at 73.
Take Profits:
TP1= @ 4100.14
TP2= @ 4628.64
TP3= @ 5359.64
TP4= @ 5853.13
TP5= @ 6346.62
SL= Break below S2
❤️ If you find this helpful and want more FREE forecasts in TradingView
. . . . . Please show your support back,
. . . . . . . . Hit the 👍 LIKE button,
. . . . . . . . . . Drop some feedback below in the comment!
❤️ Your support is very much 🙏 appreciated!❤️
💎 Want us to help you become a better Forex / Crypto trader?
Now, It's your turn!
Be sure to leave a comment; let us know how you see this opportunity and forecast.
Trade well, ❤️
ForecastCity English Support Team ❤️

💡Don't miss the great buy opportunity in MKRUSD @MakerDAOTrading suggestion:
". There is a possibility of temporary retracement to the suggested support line (3485.14).
. if so, traders can set orders based on Price Action and expect to reach short-term targets."
Technical analysis:
. MKRUSD is in an uptrend, and the continuation of the uptrend is expected.
. The price is above the 21-Day WEMA, which acts as a dynamic support.
. The RSI is at 73.
Take Profits:
TP1= @ 4100.14
TP2= @ 4628.64
TP3= @ 5359.64
TP4= @ 5853.13
TP5= @ 6346.62
SL= Break below S2
❤️ If you find this helpful and want more FREE forecasts in TradingView
. . . . . Please show your support back,
. . . . . . . . Hit the 👍 LIKE button,
. . . . . . . . . . Drop some feedback below in the comment!
❤️ Your support is very much 🙏 appreciated! ❤️
💎 Want us to help you become a better Forex / Crypto trader ?
Now, It's your turn !
Be sure to leave a comment; let us know how you see this opportunity and forecast.
Trade well, ❤️
ForecastCity English Support Team ❤️

MKR Look at the trend of this valuable coin from any direction, it is quite upward.
Very beautiful touched the first target
The next targets are short-term.
In the long term, it has the potential to become $ 10,000.
My love coin ❤️😍

mkrMy favorite coin with attractive targets.
It is wild in the ups and downs of the market and can easily hit targets.
Look at the Ichimoku cloud at the bottom of the chart

MKR - August 9th 2021This asset moves slowly, until its not. It's scarce too, but we're here for the charts and you can research fundamentals on your own. Already in uptrend on daily. Rising tide lifts all ships..should benefit if BTC and ETH are ready to continue onnward and upwards.

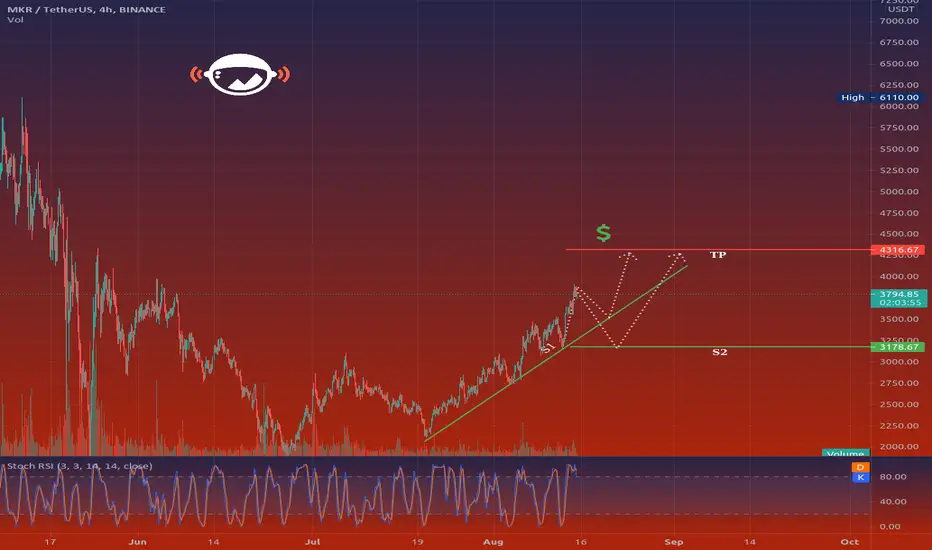
MKRUSDT (Maker) - Coin of the Week Maker (MKR) is the governance token of the MakerDAO and Maker Protocol, which are both built on the Ethereum blockchain and allow users to create and administer the DAI stablecoin. Initially conceived in 2015 and fully launched in December 2017, Maker is a project whose task is to operate DAI, a community-managed decentralized cryptocurrency with a stable value soft-pegged to the US dollar. MKR tokens act as a kind of voting share for the organization that manages DAI; while they do not pay dividends to their holders, they do give the holders voting rights over the development of Maker Protocol and are expected to appreciate in value in accordance with the success of DAI itself. The Maker ecosystem is one of the earliest projects on the decentralized finance (DeFi) scene: the industry that seeks to build decentralized financial products on top of smart-contract-enabled blockchains, such as Ethereum.
Technically, when we look at the 4h chart we see an up move that started on the 20th of July that continues to make higher highs in this structure. For the next high probability move, we see a correction that will probably reach the blue trendline marked on the chart and then a continuation to the upside. Potential target for this move is the resistance area marked on the chart at 4200 USDT. If the price breaks the blue trendline and consolidates below we may see a move to reach the low again (lower probability move).
Trade with care.
Best regards,
Financial Flagship
Disclaimer: The analysis provided is purely informative and it should not be used as financial advice. Remember that you need a plan before you start trading; so, take this knowledge and use it as a guidebook that will ultimately help you understand the market and easily predict your next move.
