MNT/USDT Testing Strong Demand Zone – Rebound or Breakdown AheadDetailed Analysis of MNT/USDT (2D Timeframe):
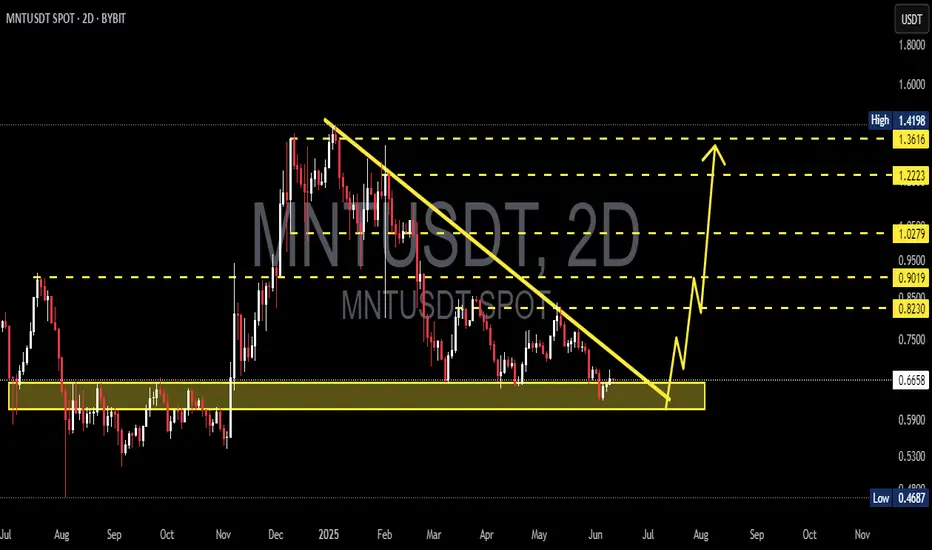
The MNT/USDT pair is currently testing a strong demand zone between $0.44 – $0.58, which has acted as a key accumulation area since 2024. This level has previously triggered strong bullish reversals, making it a crucial point for the next move.
📈 Bullish Scenario:
Active Demand Zone: Price is currently sitting in a well-established demand area (highlighted in yellow), indicating potential for a strong bounce if buying pressure increases.
Upside Potential: A bounce from this zone may push price toward key resistance levels:
$0.6612 (initial minor resistance)
$0.8002 (psychological and technical barrier)
$0.9038 and $0.9500 (previous resistance zones)
Further Fibonacci extension and major resistance levels at: $1.0632, $1.2255, and $1.4126
Pattern Formation: There is potential for a Double Bottom pattern if price rebounds and breaks above $0.80, confirming a medium-term bullish reversal.
📉 Bearish Scenario:
Breakdown Risk: A confirmed breakdown below the $0.5836 support and especially under $0.44 would flip the structure to bearish.
No Strong Support Below: A drop beneath $0.44 could trigger a free fall toward $0.35 or lower, with minimal technical support in that range.
Bearish Confirmation: A breakdown with high selling volume would signal a strong distribution phase and continuation of the downtrend.
🔍 Pattern & Market Structure Summary:
The zone between $0.44 and $0.58 represents a long-term accumulation base.
If this level holds, it could spark a significant bullish move, especially if accompanied by strong volume and market sentiment.
If it fails, the chart will confirm a structural breakdown, with potential for deeper bearish continuation.
📌 Key Levels to Watch:
$0.44 – $0.58 Main Support / Demand Zone
$0.6612 Minor Resistance
$0.8002 Historical Resistance
$0.9038 – $0.9500 Key Resistance Zone
$1.0632 – $1.4126 Bullish Extension Targets
#MNTUSDT #CryptoAnalysis #TechnicalAnalysis #AltcoinSetup #DemandZone #BreakoutTrade #BullishScenario #BearishScenario #CryptoSignal
MNTUSDT trade ideas

MNT | At SupportMNTUSDT has reached a critical support zone around $0.5742, presenting a potential buying opportunity. The price is testing the green support area that has held multiple times historically, suggesting this level remains significant for buyers.
Key Technical Observations:
Price currently testing major support zone (green box)
RSI showing oversold conditions around 40, indicating potential for bounce
Previous support levels in this range have generated strong reversals
Downtrend from recent highs appears to be losing momentum
Potential Trade Setup:
Entry: Current levels around $0.5742 support zone
Target 1: $0.7000 (previous resistance area)
Target 2: $0.8500 (higher resistance zone)
Stop Loss: Below $0.5000 to manage downside risk
Risk Factors:
Broader market conditions could pressure the support further
Break below $0.5000 would invalidate the bullish scenario
Volume confirmation needed for sustainable bounce
The risk-to-reward ratio appears favorable at current levels, but traders should monitor for volume confirmation and overall market sentiment.

Mantle (MNT): Filled Bullish CME | Eyes on 200EMAMantle coin has recently filled the bullish CME gap, where we might be seeing some sort of weakness.
Now our game gameplan will work only if we see proper rejection from current zones, which would then send the price back to the 200EMA (where we will be looking for a break of that zone). After that we will be going into a short position so eyes on it.
Swallow Academy

MNT: Close to the Accumulation Range.Hello Traders,
Here’s an update on MNT using the weekly timeframe.
MNT is currently in a downtrend and approaching a potential accumulation range. We’ve seen MNT rebound from this specific range in the past, and if it follows a similar pattern, it could present a good opportunity.
Bullish Scenario: A rebound from $0.50 to $0.60
Bearish Scenario: A breakdown below the accumulation range
Strategy:
~ Entry: $0.50 to Current Market Price (CMP)
~ Invalidation: A breakdown and close below the entry range
~ Target: $1 – $1.5
~ Holding Period: Q3
Note: Always do your own research and analysis before investing.
Regards,
Dexter

Mantle (MNT): Buyside Volume Gathering!Mantle coin has had a nasty dip recently, whereas as of now we see some kind of buyside volume gathering up.
We are targeting here the 200EMA line, after which we might be seeing some kind of weakness.
There are 3 possible times to take positions so let's wait out for proper confirmations now.
Swallow Academy

MNTUSDT 2D AnalysisMNT ~ 2D Analysis
#MNT Buy back gradually from this support block with a short term target of at least 10%+ from here. Long term target $1.4
MNT – Accumulating Nicely, Ready to Join the TrendMNT is accumulating beautifully—this looks ready to follow $AAVE.
Stepping in and adding it to the basket of coins I’m comfortable holding.
It’s forming a solid weekly base, and a new trend could trigger as early as next week.
Anticipating the move here, with risk defined below 70c.
Targeting a 2x, as it’s still consolidating within a massive range. BYBIT:MNTUSDT

$MNT It's Heating Up Again!After a clean breakout above the macro downtrend, MNT TSX:MNT is now retesting the trendline as support, a textbook bullish retest.
Price is holding the green accumulation zone, and if bulls step in, the path to $0.95 → $1.23 → $1.39 opens up!
That’s a potential 100%+ move from current levels. 💥
The structure looks strong. Momentum is building.
Don’t sleep on Mantle.
DYRO, NFA

MNTUSDT 1D#MNT has broken above the descending triangle on the daily chart. Currently, it has been rejected by the daily MA100 and is heading towards retesting the descending triangle line and the daily EMA50. In case of a successful bounce, the targets are:
🎯 $0.9434
🎯 $1.0343
🎯 $1.1253
🎯 $1.2548
⚠️ Use a tight stop-loss.

MNTUSDT 1D Analysis MNT ~ 1D Analysis
#MNT Buy gradually after successfully breaking through this resistance line with a short-term target of at least 10%++

MNT – The Breakout Is Brewing!Mantle is holding strong inside a rising channel, building a solid base for what looks like a major move ahead. TSX:MNT might just be gearing up for its big moment. 🚀
✅ Current price: $0.81
📈 Technical upside potential:
$1.28 (+59%)
$1.71 (+110%)
$2.91+ (+269%) 🔥
📊 Price is consolidating above trendline support
🧱 Long accumulation = pressure building for a breakout
🧠 MNT isn’t just another token — it’s one of the most promising L2 plays with real fundamentals and growing ecosystem traction.

MNT LONGVolume boosted, successfully penetrating this resistance line with a short -term target of at least 10%+ from here.


TradeCityPro | MNTUSDT The Best Coin for Short Positions👋 Welcome to TradeCityPro Channel!
Let’s dive into the analysis of the popular DeFi coin that’s active on the Mantle chain—where they’re running multiple airdrops and utilizing it for fees. Let’s break it down and analyze it together!
🌐 Overview Bitcoin
Before starting the analysis, I want to remind you again that we moved the Bitcoin analysis section from the analysis section to a separate analysis at your request, so that we can discuss the status of Bitcoin in more detail every day and analyze its charts and dominances together.
This is the general analysis of Bitcoin dominance, which we promised you in the analysis to analyze separately and analyze it for you in longer time frames.
📊 Weekly Timeframe
After hitting 1.4077, which was our previous ATH, there were practically no buyers present here, preventing us from breaking this key ceiling and moving upward.
Additionally, after the rejection from this high and an engulfing of the previous two candles, it’s safe to say our upward movement has concluded, and we’re now heading into at least a period of correction. This has already started as we’ve entered a resting phase from the prior trend.
However, after breaking 0.9030 coinciding with the news of the Bybit hack and the theft of Ethereum and its coins by North Korean hackers we experienced a sharp drop. Given that Bybit held a large volume of this token, the decline was even more pronounced.
📉 Daily Timeframe
In the daily timeframe, after the rejection from 1.4077 and a deep drop, we moved upward again. This time, we hit resistance at 1.2353 multiple times, but nothing happened buyers couldn’t push above this level.
With this lack of buying pressure, sellers stepped into the market. We then formed a support at 1.0102, but after breaking it along with the hack news we saw a sharp drop down to 0.06552! This level is highly significant!
It’s important because this was previously a key resistance, and after breaking it earlier, we kicked off our main uptrend. So, it’s a critical support now, and it won’t break easily! However, if this support does fail, we’ll likely see a drop to 0.5340.
For buying, it’s not a good time yet. But if we get support at 0.6552 with a strong daily candle, we could consider a buy. Alternatively, wait for a box formation and structure. Our current entry trigger would be a break above 0.8464. For selling, my stop loss would be below 0.5340.
🕓 4-Hour Timeframe
In the 4-hour timeframe, after a rejection from 0.8492, we moved down to 0.6539, where we’re currently ranging around this support. A break of this level could set up an excellent short position opportunity.
For a short position, breaking below 0.6539 offers a clean and complete trigger, allowing us to capitalize on this move.
For a long position, we have a couple of scenarios: a fake breakout of the critical 0.6539 support or a break above the 0.6716 trigger could justify opening a long. While there are better coins for longs, a break of the ceiling with higher highs and lows could also warrant a long position.
✍️ Final Thoughts
Stay level-headed, trade with precision, and let’s capitalize on the market’s top opportunities!
This is our analysis, not financial advice always do your own research.
What do you think? Share your ideas below and pass this along to friends! ❤️

TradeCityPro | MNTUSDT Effects of the Bybit Hack👋 Welcome to TradeCityPro Channel!
Let’s dive into the analysis of the popular DeFi coin that’s active on the Mantle chain—where they’re running multiple airdrops and utilizing it for fees. Let’s break it down and analyze it together!
🌐 Overview Bitcoin
Before starting the analysis, I want to remind you again that we moved the Bitcoin analysis section from the analysis section to a separate analysis at your request, so that we can discuss the status of Bitcoin in more detail every day and analyze its charts and dominances together.
This is the general analysis of Bitcoin dominance, which we promised you in the analysis to analyze separately and analyze it for you in longer time frames.
📊 Weekly Timeframe
After hitting 1.4077, which was our previous ATH, there were practically no buyers present here, preventing us from breaking this key ceiling and moving upward.
Additionally, after the rejection from this high and an engulfing of the previous two candles, it’s safe to say our upward movement has concluded, and we’re now heading into at least a period of correction. This has already started as we’ve entered a resting phase from the prior trend.
However, after breaking 0.9030—coinciding with the news of the Bybit hack and the theft of Ethereum and its coins by North Korean hackers—we experienced a sharp drop. Given that Bybit held a large volume of this token, the decline was even more pronounced.
📉 Daily Time Frame
In the daily timeframe, after the rejection from 1.4077 and a deep drop, we moved upward again. This time, we hit resistance at 1.2353 multiple times, but nothing happened—buyers couldn’t push above this level.
With this lack of buying pressure, sellers stepped into the market. We then formed a support at 1.0102, but after breaking it—along with the hack news—we saw a sharp drop down to 0.06552! This level is highly significant!
It’s important because this was previously a key resistance, and after breaking it earlier, we kicked off our main uptrend. So, it’s a critical support now, and it won’t break easily! However, if this support does fail, we’ll likely see a drop to 0.5340.
For buying, it’s not a good time yet. But if we get support at 0.6552 with a strong daily candle, we could consider a buy. Alternatively, wait for a box formation and structure. Our current entry trigger would be a break above 0.8464. For selling, my stop loss would be below 0.5340.
✍️ Final Thoughts
Stay level-headed, trade with precision, and let’s capitalize on the market’s top opportunities!
This is our analysis, not financial advice always do your own research.
What do you think? Share your ideas below and pass this along to friends! ❤️

Trading opportunity for MNTUSDTBased on technical factors there is a Sell position in :
📊 MNTUSDT
🔴 Sell Now
🪫Stop loss 0.8860
🔋Target 0.7000
📏 R/R 1,8
💸RISK : 1%
We hope it is profitable for you ❤️
Please support our activity with your likes👍 and comments📝

TradeCityPro | MNTUSDT Effects of Bybit Hack👋 Welcome to the TradeCityPro channel!
Let's analyze and examine the main chain mantle coin and examine the effects of the Bybit hack last month
🌐 Overview Bitcoin
Before starting the analysis, I want to remind you again that we moved the Bitcoin analysis section from the analysis section to a separate analysis at your request, so that we can discuss the status of Bitcoin in more detail every day and analyze its charts and dominances together.
This is the general analysis of Bitcoin dominance, which we promised you in the analysis to analyze separately and analyze it for you in longer time frames.
📊 Weekly Timeframe
On the weekly time frame, this coin was in good condition and was near its new high and could even break this resistance level well!
But the continuous events of the crypto market caused a deep correction of 50% of this chart, from Trump's tariffs to the Bybit hack, and since the MNT coin was one of the main Bybit holding coins, it caused its recent fall.
In this timeframe, we made our purchase for DeFi at the level of 0.6577 and now it is only a little in profit, although we took out some with the weekly engulfing candle, but I will continue to hold and if we lose 0.5457, I will exit completely.
📈 Daily Timeframe
In the daily timeframe, after the daily box between 0.5457 and 0.6622 broke and momentum entered, we started our move and reached a very important resistance level of 1.3947 and after that we recorded a lower ceiling.
After breaking the important bottom of 0.9311, the exit trigger It was our spot that became active and after pulling back to it, we experienced a continued decline and now we are back to important support which was previously the ceiling of our ascending box and is an important level for us!
It is not a good time to buy again right now and we need to form a new structure, but the fact that we have a weak downtrend can be a good sign in itself, but we still need to create new space for now. For selling, I will wait and cash out my coins below 0.5457 and say goodbye to this coin without bias :))
📝 Final Thoughts
Stay calm, trade wisely, and let's capture the market's best opportunities!
This analysis reflects our opinions and is not financial advice.
Share your thoughts in the comments, and don’t forget to share this analysis with your friends! ❤️

MNT LONG IDEALooks like market is giving us MNT at the good entry point for long. Point of Control is at 1.0372 I am in long. Take partial profits at TP1 0.9903.

UNIVERS OF SIGNALS| MNT: Deep Dive into Mantle's Market Dynamics👋 Welcome to UNIVERS OF SIGNALS !
In this analysis, I want to examine the coin MNT for you, which was requested in the comments. So, if you want a particular coin analyzed, feel free to mention it in the comments, and I will review and analyze it for you.
👀 Mantle project is one of the Ethereum Layer-2 projects, and its official coin is MNT. Like other Ethereum Layer-2s, its aim is to provide greater scalability, faster transactions, and lower fees. Let's proceed to technically analyze this coin.
📅 Weekly Timeframe
In the weekly timeframe, as you can see, there aren't many candles in the chart since the project is set for 2024, and it hasn’t been long since the coin was listed. As you can observe, the price is in a large range box from $0.5443 to $1.4049, hitting the bottom and top of this box several times in this timeframe.
📊 The market volume is ranging, and it seems that there hasn't been much difference in the inflows and outflows of money in this range box. The most critical trigger for buying spot right now is the breakout of $1.4049, which is the ATH resistance of this coin. If this resistance is broken, the price could move towards higher targets. If this resistance is breached, I will update the analysis for you and review the upcoming resistances and potential targets together.
✨ Besides these two important areas, there is also the $0.8946 area, which seems very important, and as you can see, the price has had many contacts with this area in the shadow in this timeframe. The main support, as mentioned, is at $0.5443, and if this area is broken, we could say that the trend of this coin will be bearish.
📉 The last support, which is also the main price floor and ATL, is $0.3197, which could be the first bearish target if this coin becomes bearish. Given the small number of weekly candles, I don't see any other specific data in this chart, so it's better to move on to the daily timeframe to see the market with more detail.
📅 Daily Timeframe
As you can see in the daily timeframe, we can examine the price movements with much more detail, and as you see, there was a box between the area of $0.5453 to $0.6533, where the ascending trend of this coin started after breaking the top of this area and continued up to the area of $1.3961.
🔍 After the price reached this area and completed its ascending leg, a new box was formed, with the bottom of this box at $0.9490 and the top, as mentioned, at $1.3961.
🔽 The price has tested the floor and ceiling of this box several times and is currently near the box's floor. Therefore, if the floor of the box breaks, we can expect further corrections, which might reach the 0.618 and 0.786 Fibonacci areas, where the 0.618 area corresponds to $0.7736, and the 0.786 area roughly overlaps with the $0.6533 support.
⚡️ In RSI, as you see, we have a very good area where the floor is 41.97, and the ceiling is 55.86. Breaking either of these areas could indicate the entry of momentum in that direction in the market.
💥 The market volume is decreasing after reaching the box's ceiling, indicating that a market movement is approaching. Therefore, you can enter a position if the ceiling or floor of the box breaks. I suggest you keep an eye on it to do so. An earlier trigger for a long would be 1.2341.
⏳ 4-Hour Timeframe
In this timeframe, I want to specify only the futures triggers for you because we have already performed the analysis in higher timeframes, and there is no need to repeat the same discussions.
🔑 For a short position, you can enter if 1.0062 breaks. I don't see a good area in RSI for a break and the entry of bearish momentum. However, the main short position, which would be if 0.9490 breaks, could overlap with a break of 30 in RSI.
📈For a long position, you can enter if 1.0685 breaks, but this position is very risky, and the main long positions would be if 1.2341 and 1.3961 break. A break of 55.86 in RSI could be a suitable confirmation for a risky long position and might overlap with the area of 1.0685.
💫 Market volume has decreased significantly in recent days. As I mentioned in the Bitcoin analyses, so be aware that, as I said, when the volume decreases and reaches its possible minimum, the market movement will be much easier, sharper, and faster.
📝 Final Thoughts
This analysis reflects our opinions and is not financial advice.
Share your thoughts in the comments, and don’t forget to share this analysis with your friends! ❤️

TradeCityPro | MNT: Deep Dive into Mantle's Market Dynamics👋 Welcome to TradeCityPro!
In this analysis, I want to examine the coin MNT for you, which was requested in the comments. So, if you want a particular coin analyzed, feel free to mention it in the comments, and I will review and analyze it for you.
👀 Mantle project is one of the Ethereum Layer-2 projects, and its official coin is MNT. Like other Ethereum Layer-2s, its aim is to provide greater scalability, faster transactions, and lower fees. Let's proceed to technically analyze this coin.
📅 Weekly Timeframe
In the weekly timeframe, as you can see, there aren't many candles in the chart since the project is set for 2024, and it hasn’t been long since the coin was listed. As you can observe, the price is in a large range box from $0.5443 to $1.4049, hitting the bottom and top of this box several times in this timeframe.
📊 The market volume is ranging, and it seems that there hasn't been much difference in the inflows and outflows of money in this range box. The most critical trigger for buying spot right now is the breakout of $1.4049, which is the ATH resistance of this coin. If this resistance is broken, the price could move towards higher targets. If this resistance is breached, I will update the analysis for you and review the upcoming resistances and potential targets together.
✨ Besides these two important areas, there is also the $0.8946 area, which seems very important, and as you can see, the price has had many contacts with this area in the shadow in this timeframe. The main support, as mentioned, is at $0.5443, and if this area is broken, we could say that the trend of this coin will be bearish.
📉 The last support, which is also the main price floor and ATL, is $0.3197, which could be the first bearish target if this coin becomes bearish. Given the small number of weekly candles, I don't see any other specific data in this chart, so it's better to move on to the daily timeframe to see the market with more detail.
📅 Daily Timeframe
As you can see in the daily timeframe, we can examine the price movements with much more detail, and as you see, there was a box between the area of $0.5453 to $0.6533, where the ascending trend of this coin started after breaking the top of this area and continued up to the area of $1.3961.
🔍 After the price reached this area and completed its ascending leg, a new box was formed, with the bottom of this box at $0.9490 and the top, as mentioned, at $1.3961.
🔽 The price has tested the floor and ceiling of this box several times and is currently near the box's floor. Therefore, if the floor of the box breaks, we can expect further corrections, which might reach the 0.618 and 0.786 Fibonacci areas, where the 0.618 area corresponds to $0.7736, and the 0.786 area roughly overlaps with the $0.6533 support.
⚡️ In RSI, as you see, we have a very good area where the floor is 41.97, and the ceiling is 55.86. Breaking either of these areas could indicate the entry of momentum in that direction in the market.
💥 The market volume is decreasing after reaching the box's ceiling, indicating that a market movement is approaching. Therefore, you can enter a position if the ceiling or floor of the box breaks. I suggest you keep an eye on it to do so. An earlier trigger for a long would be 1.2341.
⏳ 4-Hour Timeframe
In this timeframe, I want to specify only the futures triggers for you because we have already performed the analysis in higher timeframes, and there is no need to repeat the same discussions.
🔑 For a short position, you can enter if 1.0062 breaks. I don't see a good area in RSI for a break and the entry of bearish momentum. However, the main short position, which would be if 0.9490 breaks, could overlap with a break of 30 in RSI.
📈For a long position, you can enter if 1.0685 breaks, but this position is very risky, and the main long positions would be if 1.2341 and 1.3961 break. A break of 55.86 in RSI could be a suitable confirmation for a risky long position and might overlap with the area of 1.0685.
💫 Market volume has decreased significantly in recent days. As I mentioned in the Bitcoin analyses, so be aware that, as I said, when the volume decreases and reaches its possible minimum, the market movement will be much easier, sharper, and faster.
📝 Final Thoughts
This analysis reflects our opinions and is not financial advice.
Share your thoughts in the comments, and don’t forget to share this analysis with your friends! ❤️

MNTUSDT: 52% Potential from Rejection Block!🚀 MNTUSDT: 52% Potential from Rejection Block!
🧐 Analysis:
Rejection Block Identified – Key price zone for reversal 🔄
52% Potential Move – Strong upside if the rejection holds 📈
Price Action Watch: If price confirms rejection, a solid move could follow 🚀
🎯 Plan: Monitor for confirmation at the rejection block and take advantage of the potential 52% move! 🔥📊

MNT/USDT Trading Plan – February 2025Current Market Overview:
Price: $1.19
Resistance: $1.32
Support: $1.10
Indicators:
RSI: 53.74 (Neutral, with room for upside)
EMA (8): $1.14 (Bullish crossover)
Volume: Increasing, indicating accumulation
Trade Setup:
📈 Entry: $1.20 - $1.25 (Breakout confirmation above key resistance)
📊 Take Profit Targets:
TP1: $2.00 (+65%)
TP2: $3.00 (+150%)
🔻 Stop Loss: $1.08 (Close below support to minimize risk)
Technical Justification:
Bullish Pennant Pattern: Breakout expected if volume increases
Trend Confirmation: Above $1.32 = strong rally potential
Momentum Shift: RSI above 53 suggests growing buying pressure
Recent News & Fundamentals:
Massive Growth: November 2024 rally saw +74% gains in 5 days
Investor Confidence: Active addresses & network growth at 3-month highs
Market Sentiment: Bitcoin's rally fuels altcoin interest
Risk Management:
Position size 1-3% of portfolio
Adjust stop-loss dynamically as price moves toward targets
🚀 Conclusion:
With a breakout above $1.32, MNT has strong potential for a sustained bullish move. Investors should monitor volume and confirm breakout before entering. This setup offers a high-reward opportunity with a favorable risk-to-reward ratio.
📌 Stay updated & adjust accordingly.

MNT/USDT | 4-Hour Breakout SetupThis MNT/USDT 4-hour chart presents a potential breakout trade from a symmetrical triangle pattern:
Entry: $1.1036, targeting a breakout from the resistance zone.
Stop-Loss: Placed at $1.0462, below the order block (OB) zone for risk management.
Take-Profit: Aiming for $1.2089, expecting a bullish breakout continuation.
The trade setup suggests a strong breakout move, but confirmation via volume and candlestick formation is advised before execution.
