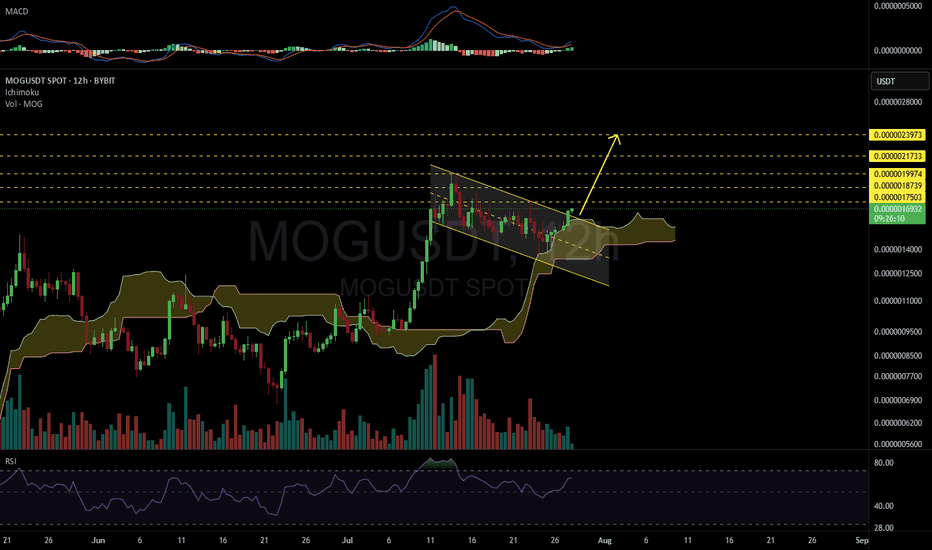
MOGUSDT 12H#MOG has broken above the bullish flag on the 12H timeframe. The Ichimoku Cloud is also providing solid support in this area.
In case of a successful retest of the flag, the upside targets are:
🎯 $0.0000017503
🎯 $0.0000018739
🎯 $0.0000019974
🎯 $0.0000021733
🎯 $0.0000023973
⚠️ As always, use a tight stop-loss and apply proper risk management.
MOGUSDT trade ideas
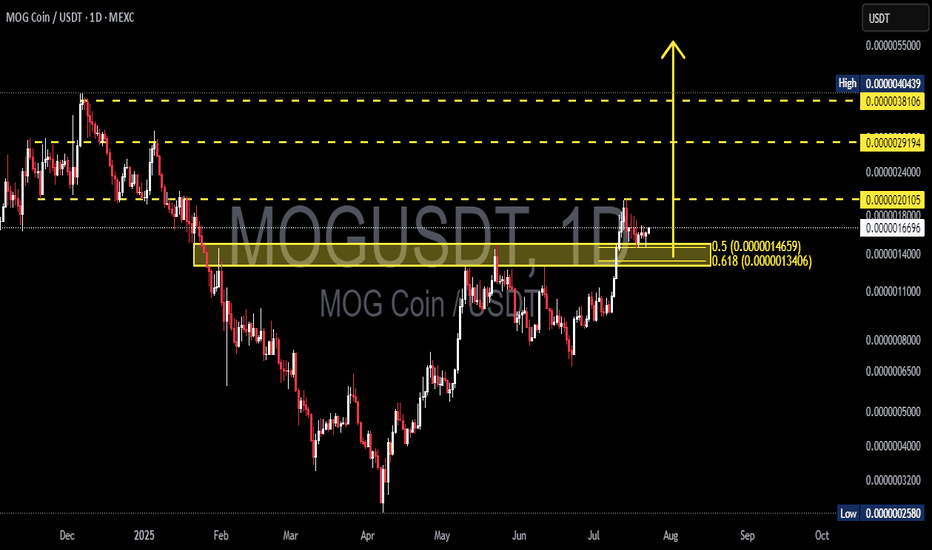
MOGUSDT – Bullish Retest of Breakout Zone, Ready for Explosive?🧠 Overview:
MOG Coin (MOGUSDT) is painting a textbook bullish continuation pattern after a clean breakout from a multi-month accumulation range. The current price action shows a retest of the key breakout zone, aligning with Fibonacci Golden Pocket levels (0.5 & 0.618) — a region often respected by institutional algorithms and smart money. This setup offers a high-reward trading opportunity if momentum continues.
🔍 Technical Breakdown:
🔸 Major Support Zone (Golden Pocket):
0.000014659 (Fib 0.5)
0.000013406 (Fib 0.618)
This confluence zone served as resistance for months and has now flipped into strong demand/support, acting as a launchpad for further upside.
🔸 Price Structure:
The structure forms a "Cup & Handle"-style breakout, with the handle currently forming as a bullish retest.
Strong impulsive move in early July broke out above the resistance with above-average volume — confirming bullish intent.
Current consolidation is healthy and corrective, not impulsive to the downside.
🟢 Bullish Scenario: (High Probability)
If the golden pocket zone holds and price maintains above 0.000016543, the following upside targets are in play:
1. 🎯 Target 1: 0.000021005 – Minor horizontal resistance
2. 🎯 Target 2: 0.000024000 – Mid-range resistance from prior breakdown
3. 🎯 Target 3: 0.000029194 – Significant former support-turned-resistance
4. 🎯 Target 4: 0.000038106 – Pre-capitulation resistance
5. 🎯 Target 5: 0.000040439 – Macro High (Previous Cycle Peak)
> 📈 Measured move projection from breakout zone to top equals ~170% potential upside from current levels.
🔴 Bearish Scenario: (Low Probability but Cautionary)
Breakdown below 0.000013400 (Fib 0.618) would invalidate the bullish structure.
Price could revisit:
⚠️ 0.000011000 (mid-term support zone)
⚠️ 0.000008000 (bottom of accumulation)
Failure to reclaim golden zone quickly would imply a fake breakout and possible distribution.
🔄 Key Confirmation Levels:
Above 0.000018000 = continuation confirmation ✅
Below 0.000013400 = caution zone 🚫
🔔 Volume & Momentum:
Look for volume spike and candle close above local resistance to confirm breakout continuation.
RSI currently neutral – room for upside without being overbought.
📌 Summary:
MOGUSDT has completed its accumulation phase and is entering markup territory. The current dip presents an optimal entry near support with a well-defined invalidation point. If the structure holds, we could witness a significant price expansion toward historical resistance levels.
> This setup aligns with classic Wyckoff theory and Fibonacci retracement confluence — a recipe often seen before major altcoin rallies.
🧩 Chart Pattern:
✅ Cup & Handle Breakout
✅ Fibonacci Golden Pocket Retest
✅ Volume-Supported Breakout
✅ Reclaim of Structure Zone
#MOGUSDT #AltcoinBreakout #CryptoTA #GoldenPocket #CupAndHandle #TechnicalAnalysis #BullishRetest #MOGCoin #BreakoutSetup #FibonacciMagic #Altseason2025
$MOGUSDT – Channel Breakout Confirmed!TSXV:MOG is breaking out of a well-defined descending channel, signaling potential for a strong bullish continuation. Price has flipped resistance into support and is now holding above the 50 EMA.
🔎 Setup Highlights:
Breakout from descending channel structure
Retest holding at breakout zone + 50 EMA confluence
Increasing momentum on higher timeframes
📍 Entry Zone: Around 0.0000011573
🎯 Targets:
TP2: 0.0000012884
TP3: 0.0000015608
🛑 Stop-loss: 0.0000009576
Bullish structure intact unless breakdown below retest zone. One to watch!
MOG Coin Testing Key Resistance – Breakout Ahead?🚀 TSXV:MOG Coin Testing Key Resistance – Breakout Ahead? 📈
TSXV:MOG Coin is currently testing the black resistance line. If the price breaks through, the first target could be the green line level. A clean breakout here could signal strong upward momentum. 📊
Let’s capitalize on this potential move! 💼💸
MOG (Mog Coin) Bounce Trade Setup – Early Recovery in PlayMOG is showing early reversal signs by reclaiming a key HTF support zone and forming a higher low near the 21-day moving average. This indicates a potential momentum shift and a solid bounce opportunity if follow-through volume confirms.
🔹 Entry Zone:
$0.00000060
🎯 Take Profit Levels:
🥇 $0.00000084
🥈 $0.00000110
🛑 Stop Loss:
$0.00000050 (below structure, protects against invalidation)
Mogcoin and the completion of the downward cycle; $0.000000068On the 4-hour chart of Mogcoin, equilibrium levels are marked from two highs of December 2024 and January 2025. As you can see on the chart, the recent reversal of Mogcoin price is due to entering the main zone of the January high and the market has not yet reached the downside of the main high in December... The equilibrium downside target of 0.000000068 will be touched to complete the equilibrium price cycle from the main highs....
In the long term and after completing the downward cycle, Mogcoin will reach the weekly bullish target of 0.0000041$.
Note: Equilibrium analyses look at the market on a large scale and macro scale and the targets may be delayed but will be touched...
MOGUSDT The MOG currency has fallen a lot and broke the channel floor a few weeks ago. I analyzed a similar channel in green below it and now it has returned from the support of the channel floor and is considered suitable for buying for investment. Be sure to get an entry trigger to complete the purchase.
No clear signs of reversals yetDowntrend dominance – Price remains under key EMAs.
Weak momentum – Stochastic oversold, no bullish crossover yet.
Resistance ahead – $0.0000009650 is a key level.
Volume declining – No strong buying pressure visible.
Bearish sentiment – Trend suggests further downside risk.
All-in-1 BB,Stoch,RSI+PSAR+Keltner +ADX with Signals and AlertsThis invite-only indicator combines multiple advanced tools into a single script, generating buy/short signals alongside comprehensive alerts. Priced at just 25/month, it’s ideal for both manual trading and integration with bots.
Key Features & Alerts
Buy & Short Signals
Quickly identify potential long or short entries.
Three Take-Profit (TP) Lines
Long: After a BUY signal, three lines appear (TP1, TP2, TP3), allowing you to take partial profits—e.g., 30%, 30%, 30%—and keep the remaining 10% to trail.
Short: Similarly, after a SHORT signal, three TP lines help you scale out as price moves in your favor.
Stop-Loss Line (Based on Bollinger Width)
Precisely calculates a stop-loss distance using Bollinger Band width (a percentage below for longs or above for shorts).
Trailing Stop-Loss
Any remaining position can be trailed under (or above) Parabolic SAR, Keltner Channels, and Bollinger, with an extra 0.2% margin for added caution.
ADX + Stoch RSI + RSI (MA)
Filter out weak trends, gauge volatility, and confirm overbought/oversold regions in real time.
Compatible With Trading Bots
Built-in alerts can be connected to bot logic (via webhooks), enabling automated management of entries, TPs, stop-losses, and trailing stops.
Why Use This Indicator?
All-in-One Script: Eliminates chart clutter by merging multiple indicators into one.
Partial Take-Profits: Clearly defined TP1, TP2, TP3 lines help you lock in gains progressively.
Enhanced Risk Control: Stop-loss and trailing stop lines update automatically, keeping your trades protected.
Easy Bot Integration: Perfect for traders wanting direct alerts or automated trading setups.
Invite-Only for Exclusive Access: Maintain a competitive edge with protected source code.
How to Use:
Add to Chart
After access is granted, go to Indicators → Invite-Only Scripts and select this script.
Enable Specialized Alerts
Receive notifications for Buy/Short signals, the three TP lines, Stop-Loss, and Trailing Stop events.
Scale Out or Automate
Manually close partial positions at the TP lines (e.g., 30% each time) and let the remaining 10% trail for bigger moves.
Or link these alerts to a trading bot for fully automated position management.
Price: 25/month
Interested? Contact me (via direct message or email) for more details and to subscribe. Experience clearer charts, timely signals, and robust risk management in one invite-only package!
MOG Long Spot Opportunity Market Context:
MOG has retraced significantly from its all-time high but continues to maintain an upward trend—a rarity among meme coins. Price is approaching a critical support zone, presenting a strong risk-to-reward opportunity for a long trade.
Trade Details:
Entry Zone: $0.0000012
Take Profit Targets:
$0.0000025
$0.0000030
$0.0000035
Stop Loss: Daily close below $0.0000010
This setup provides an excellent opportunity to capitalize on a potential higher low formation as MOG attempts to reclaim support. Manage risk carefully! 📈
The market momentum is building, and $MOG is back in the spotlig❗️
#MOG just broke out of a descending wedge and reclaimed a key support level 👀
Targets are set at 0.00003560, 0.00004292, and 0.00005032, showcasing strong upside potential 🎯
In my opinion, TSXV:MOG could easily surpass these levels with the current bullish trend 🚀
Re-Visit MOG , Update from OCT 16thThe last Idea posted about MOG was a dead on hit. Amazing how the tOCT 16th was hit. My arrows were spot on but not with time, nailed price though, now in price discovery, Fibs can give areas to watch all 61.8's and hole numbers , best plan, don't trade, wait for BTC to top out and meme season really hits, Billions & Billions


