MONABTC It's time for history to repeat itself! 1000% gains?I think things are looking extremely bullish for MONABTC.
On the weekly we can see us reaching a long term support line and nicely holding it. On the other side we have a decending resistance line. Combined they form a falling wedge. We're currently breaking out of this wedge that is situated near the all time low. This gives us tons of upside potential and great risk to rewards. Also on the weekly charts you can see what followed after bottoming out in January 2017. Mona made an incredible 60x from the bottom after that.
When we look at oscillators and indicators we can see that
Both Willy and stochastic are oversold
Bullish divergences
And also OBV has been very steady while price kept on falling.
All these things combined tell me that things are looking good for MONABTC.
I'm definitely spreading my buy orders so I can get my hands on some extra when retesting the breakout / decending trendline.
Some targets to keep an eye on are in purple.
What do you think about this? Let me know!
Cheers,
W
MONABTC trade ideas

MONABTC / cat meme follows doge memeMONABTC / cat meme follows doge meme
MONABTC about to break bullish flag pattern any time.
ab=cd profit projection from this pattern is at 9250 sat, but we need to break bullish flag pattern and flag resistance for confirmation
if this coin drops, buyback again and again on the way down
general informations:
'Monacoin was Japan’s first native cryptocurrency. Like Dogecoin, it is based on a popular internet meme.
It was developed in 2014 by an anonymous developer calling themselves “Mr. Watanabe.”
The pseudonym is thought to be a homage to Satoshi Nakamoto.
Watanabe is a common Japanese surname and has its roots in the ferrymen’s guild of medieval times.'

MONA - Long history of oscillations. Going up nowThis chart has wicks removed for a little bit cleaner view. Mona has a relatively long history of oscillation, and from these prices on the way up, its a good long.


MONA/BTC Rising Wedge, Broke 61.8 on Fib RetracementMona already had 3 wonderful breakouts, which i personally remember to happen at the beginning of every Crypto bull run.
We're passed the 61.8 fib suggesting the market has went bear and we will start down trending.
To further suggest we've went bear, we are forming a rising wedge.

There is a trading opportunity to buy in MONABTCTechnical analysis:
. MONACOIN/BITCOIN is in a range bound and the beginning of uptrend is expected.
.The price is above the 21-Day WEMA which acts as a dynamic support.
. The RSI is at 61.
Trading suggestion:
. There is a possibility of temporary retracement to suggested support zone (0.000100 to 0.000075). if so, traders can set orders based on Price Action and expect to reach short-term targets.
Beginning of entry zone (0.000100)
Ending of entry zone (0.000075)
Entry signal:
Signal to enter the market occurs when the price comes to " Buy zone " then forms one of the reversal patterns, whether " Bullish Engulfing ", " Hammer " or " Valley " in other words, NO entry signal when the price comes to the zone BUT after any of reversal patterns is formed in the zone. To learn more about " Entry signal " and the special version of our " Price Action " strategy FOLLOW our lessons :
Take Profits:
TP1= @ 0.000139
TP2= @ 0.000175
TP3= @ 0.000220
TP4= @ 0.000278
TP5= @ 0.000346
TP6= @ 0.000395
TP7= @ 0.000490
TP8= @ 0.000585
TP9= @ 0.000890
TP10= Free
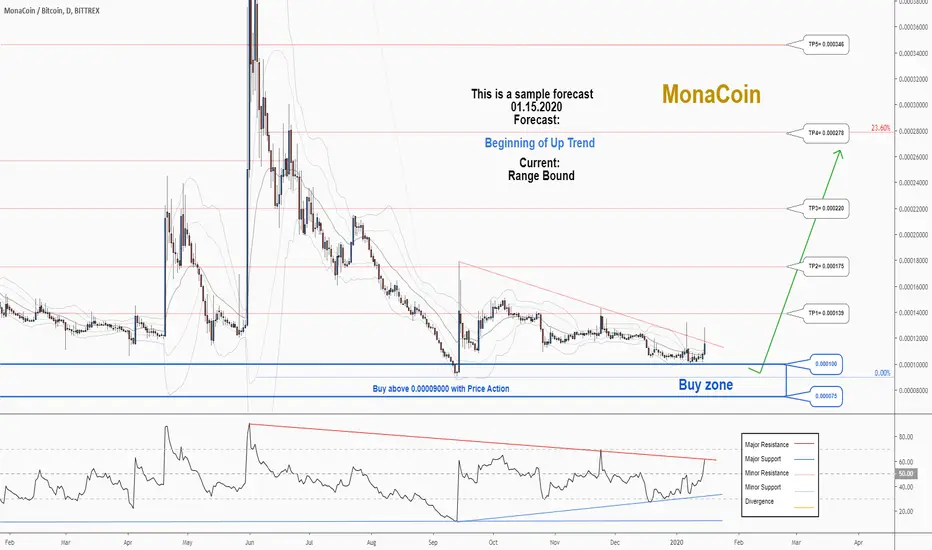


There is a trading opportunity to buy in MONABTCTechnical analysis:
. MONACOIN/BITCOIN is in a range bound and the beginning of uptrend is expected.
.The price is above the 21-Day WEMA which acts as a dynamic support.
. The RSI is at 56.
. The RSI downtrend & The price downtrend in the daily chart are broken, so the probability of the resumption of an uptrend is increased.
Trading suggestion:
. There is a possibility of temporary retracement to suggested support zone (0.00010900 to 0.00009000). if so, traders can set orders based on Price Action and expect to reach short-term targets.
Beginning of entry zone (0.00010900)
Ending of entry zone (0.00009000)
Entry signal:
Signal to enter the market occurs when the price comes to " Buy zone " then forms one of the reversal patterns, whether " Bullish Engulfing ", " Hammer " or " Valley " in other words, NO entry signal when the price comes to the zone BUT after any of reversal patterns is formed in the zone. To learn more about " Entry signal " and the special version of our " Price Action " strategy FOLLOW our lessons :
Take Profits:
TP1= @ 0.00014500
TP2= @ 0.00017500
TP3= @ 0.00022000
TP4= @ 0.00027800
TP5= @ 0.00034600
TP6= @ 0.00039500
TP7= @ 0.00049000
TP8= @ 0.00058500
TP9= @ 0.00089000
TP10= Free


{MONA} MONA to the MOON?Mona recently up 36% and broke through trend line. We find support at blue line and resist at red box. Good Luck All :)


What are you guys thinking, first time drawing my trade!!My tought on Mona,
This is my first drawing hope u guys like it,
If u have any feed back let me know,
This is no trading advise hahaha there a just my toughts about my trade.
I'm hoping for a next break out and will make sure my sell order is in the books soo it doesn't really matters when it happens.
just not sure about my stop loss.
If any off u guys have any good apps ore programs for putting in both stop losses and sell orders at once at Binance,
please let me know.


LONG MONARank 125 in the marketcap, has 19 trading pairs in 8 exchanges. Mineable coin since 2014. Daily, weekly, monthy heavily oversold.Tom Demark Count tired of counting after nine red bars. Buy when:
-KC lower band and BB lower band intersects(We have 3-4 months to go.)
and
-See monthly HL on the chart
or
-You see the monthly close above 7 day BB average
Buy @ 9500-10000*
TP1:17000*
TP2:22000*
TP3:26000*
TP4:29000*
*My opinion,not a trading advice. Good luck!

