MONABTC trade ideas


monatenkan cross on daily (left side)
3d is heating too
well weekly seems tasty too, al we need is more volume
support resistance lines on charts


MONACOIN MASSIVE UPTREND COMING!Hey Guys. Monacoin is looking pretty bullish!
This time it ended the downtrend for good.
I can see some nice 100%+ Profits incoming!
Im holding some good amounts of mona.


Inverse Head and Shoulders on Mona/BTCSome of my recent trades on mona have been failures, still breaking eggs before I hit my mark. This is definitely still looking like a hodl for me :)


MONABTC - complete with lunar cycles :)Mona possibly in the money zone, i usually put the fib on the moving average intersections but on this chart i used the high and low points of the last breakout.

Monacoin More detailed/technical ChartMonacoin still targeted for high prices.
Follow me for more analysis!


Mona/BtcLook's like we're ready to go hard again.
CCI coming back
We're above the 231
Macd slowing down it's bearish divergence

mona coin 150% potential profit in coming monthswell this is my first chat ever on trading views and here i try to chart one of a very good coin out there known as mona coin which has been going stronger and stronger.
i tried charting with a 7 day moving average and the 77 day moving average. the method i use here is the boss method alert by popular chart guru brandon kelly.
using the boss method simple moving averages indicators, the rules are simple and straight forward and has two basic beginner rule, if the 7 day ma is over the 77 day ma. it means its time to buy and if the 77 day ma is below the 7 day ma it means its time to sell it.
so using this simple method we notice that the 7 is above the 77 on the 4hr time chart which indicates a strong bullish signal. however if we do break out of the 0.00060-0.0008btc zone, we could see an easy flow all the way up to 0.001-0.0012btc in the coming months as long as the buy volume keeps increasing and there is no sharp drop or increase in Bitcoin which drives the other markets price action as well.
so do we buy now?
from all indicators monacoin has show stable price action even during the dips of the market and is increasing steadily and gradually in price. however we need one more day to confirm if the days market will close on a positive note or a negative one. if it continues to show signs of strength then i believe it will bring in about 10-35% profit before another retracement.
this has been my own contribution so far. i am in no way compelling anyone to buy or sell mona coin in any way. this are just my personal views considering my own personal experiences and should not be taken as financial advice. i employ everyone to do their due diligence and research before taking up any investment actions.

MONA's chart is bullishMonaCoin price is about to test 100-Day EMA line. The coin has fleetly bounced from 20-Day EMA which was a key support in the past days. The 100-Day and 50-Day EMA has been acting as a resistance since. Earlier the coin price tested these EMA lines but was not able to break above. MACD is currently below the ‘zero’ centerline, indicating a bearish trend, but I expect a bullish center line crossover in the next few days, when the main MACD line will move above the zero line providing more strength to the bullish trend.
If you look at MONA's chart, the MACD rised above the signal line in the past week. The RSI is reading above 50 and indicates an uptrend. Another bullish signal is visible soon when the 20-Day EMA will rise above the 50-Day EMA.This is popularly known as a golden cross, and interpreted as a buysignal. So, quite a few bullish signs there for MonaCoin. But where can you expect all of this to stop?


MonaCoin (MONA) breaking out. Very Bullish!I've been waiting for this coin to start showing some action, as I had invested in it several days ago. This coin is one of the few coins right now that is oversold on the weekly chart (1W), which means there is a lot of room for it go up. It has been doing great since few days, and it is looking to go up big time. On the short term it has already begun it's uptrend. The StochRSI is very bullish and MACD has crossed over on both the 1D chart and the 4h chart.
So we have uptrend on the short term, and bullish signals on the long term, with oversold on the 1W chart. This is enough for me share this idea now.
Please invest wisely and at your own risk. Cheers and goodluck!
Tips:
BTC - 1L6dcD8CZAdevQnjJQCeWXMsmN8WT4gPib
ETH - 0x080cC01b0abA63Bde5cC535d92F0fEd8722b1678

MONA Fractals and Breakeven of trianguleWe are about to broke the ascend triangule. Having saw the previous fractals, two conclusions:
Time to perform a big fractal and continue with long term wave 2.
Risk ratio huge :)


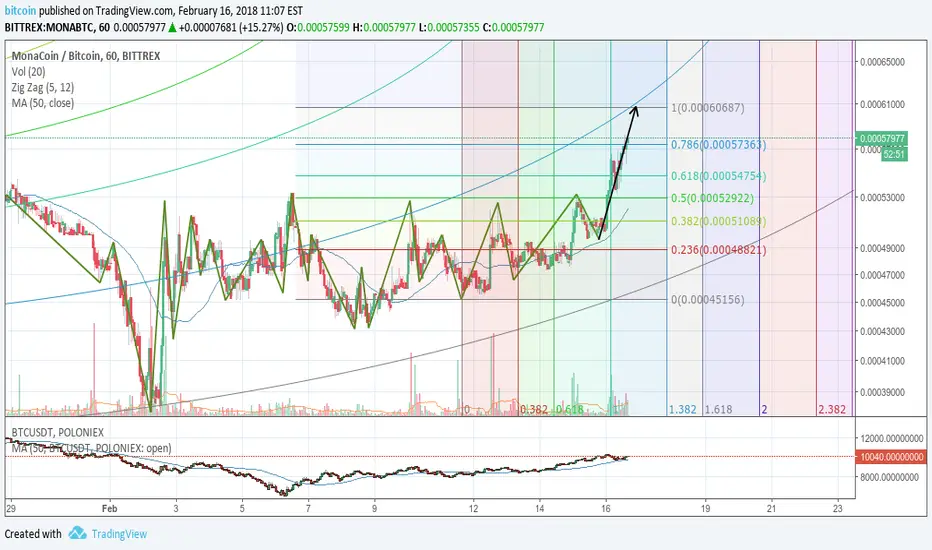
MONABTCOn the 1-hour chart we can see that 5 Elliott impulse waves were followed by ABC correction waves pattern. After this Cup & Handle pattern is forming. Right now the price is above Ichimoku cloud moreover the green line is above the red line right in the place of handle formation. Moving averages and Stoch RSI indicates oversold zone. Combining with a strong support we will have completion of the formation and the growth to the targets according to the Fib retracement levels. Buy only when it goes above Fib 0.382
