$MOVE | Bottom is likely inA solid case that TVC:MOVE is bottoming out.
1. Bullish shift in structure
2. RSI daily triple divs
3. Break of 200 4h EMA
4. Volume supported breakout
5. Reclaim of previous range
6. Liquidity pool at 0.25-0.29 untapped
On chain is also bullish:
7. DeFi apps gain revenue
8. Stable coins are flowing in
9. Dex is live, so is Yield aggregator and Lending/Borrowing platforms
10. DeFi has incentives to attract liquidity.
MOVEUSDT trade ideas

MOVE: Short-term Trade Setup.MOVE is likely to hit the support trendline ranging between $0.17 and $0,175. This will be a good entry point to long MOVE.
~ Entry: $0.17 – $0.175
~ Stop Loss (SL): $0.167
~ Leverage: 5x – 10x
~ Target: 10% – 15%
Note: This is a short-term trade, so please invest at your own risk.

MOVE/USDT – Long-Term Breakout WatchTimeframe: 4H (Long-Term Setup)
MOVE is testing a long-term descending trendline. After months of consistently lower highs, we may be on the verge of a bullish breakout.
The previous breakout attempt in April was a fakeout, but the current consolidation near resistance looks healthier and more sustainable this time.
Key Levels to Watch:
Resistance Levels (Upside Targets):
$0.1446 (Current Zone / Breakout Level)
$0.2265 – Mid-term target
$0.3397 – Key structural resistance
$0.5449 – Long-term target if trend reverses fully
Support Levels:
$0.1312 – Immediate support
$0.1173 – Major long-term base support (strongest defense)
Suggested Stop-Loss:
Below $0.117 (invalidates breakout structure)
Outlook:
If MOVE breaks and holds above the descending trendline, a major trend reversal could follow.
The setup suggests accumulation at the bottom, and volume confirmation will be key.
Patience is crucial — this is a long-term opportunity, not a quick trade. Small caps often move explosively once supply zones are cleared.
DYOR | Not Financial Advice

MOVEUSDT.P – Long Setup from 61.8%–78.6% Fibonacci Retracement ZMOVEUSDT.P is currently testing a deep retracement after a strong bullish leg. Price is reacting to the key Fibonacci zone (61.8%–78.6%), which has held as support multiple times.
Waiting for confirmation via MACD momentum shift or bullish engulfing to validate entry. Risk-managed long setup targeting a return to the recent high near 0.197.
#MOVEUSDT #CryptoTrading #BybitFutures #FibonacciStrategy #FibEntry #CopyTrading #TechnicalAnalysis #MACD

Move long back to $0.1654Just now opened a long position on move.
Targeting 0.1654. Will be scaling out along the way. Might scale in as well.
Market is still respecting bullish structure so I anticipate another pump soon.

move +buy and hold .
move Used by modern blockchains like Aptos and Sui, Move enables developers to build secure, scalable decentralized applications (dApps) with strong protection against common vulnerabilities.
3$ target

Move short to $0.1578just now opened a short position on move. Aiming for $0.1578
stop: $0.1710 or higher
Expecting the downtrend to continue down to daily support at $0.1578 soon.

MOVE - Movement, will it be so? 📊 MOVE/USDT Technical Analysis 🔍
The chart indicates that the asset is in a consolidation phase after a strong downtrend. Currently, the price is approaching a key resistance level, defined by the descending trendline. Let’s analyze the key points to watch:
🔹 Support and Resistance Levels (Possible stage 1 to break!)
Key Resistance: $0.60 - $0.65 (highlighted blue zone) → A breakout above this level could trigger a strong bullish move.
Major Support: $0.40 - $0.42 (highlighted blue zone) → A drop below this zone could invalidate the bullish structure.
📈 Technical Indicators
EMA 4 (black line) and longer EMA (green line) → The price is currently testing these levels, which could act as dynamic resistance.
RSI (Relative Strength Index) → Sitting near 50, indicating a neutral momentum. A move above 55-60 could confirm bullish strength.
📉 Trend Outlook
MOVE/USDT has been in a prolonged downtrend, with the descending trendline acting as a strong resistance.
If the price breaks above the $0.60 - $0.65 level, the next target zones are:
$0.80 - $0.85 (Intermediate target)
$1.20 - $1.30 (Major resistance zone from previous highs)
However, if the price gets rejected at the trendline and loses support at $0.42, we could see another bearish leg down.
🎯 Conclusion
The next move depends on whether MOVE/USDT can break above the descending resistance and the key $0.60 level. Watch for increasing volume and RSI confirmation to validate a potential breakout.

Move short to $0.1575Entered #move short just now
Might get some drawdown, entry is a bit aggressive but the stoploss of $0.1773 might be enough as the supply dump from earlier was quite aggressive so there's a good chance the market will react similar again.
Plus heard they had an airdrop today which might have been the reason for the aggressive supply dump

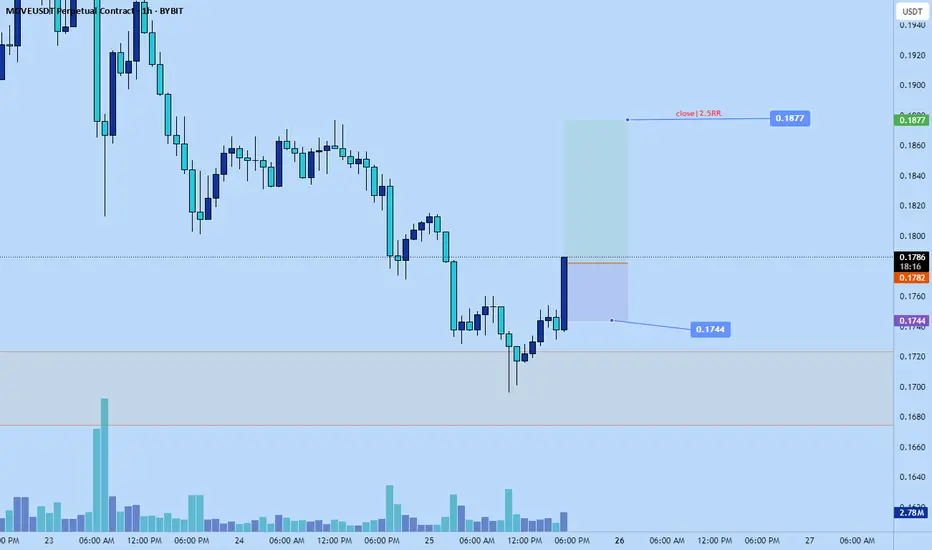
Move scalp long to $0.1877Just now entered a long position on $move. Anticipating a momentum push towards $0.1877 to flip back to a bullish trend on the 4hr tf.
Stop: $0.1744 or lower
Tp: $0.1877
Moveusdt short to $0.1725Recently opened a short position on move
Targeting $0.1725
Stop: $0.1882 or higher
Partial: $0.1760
Full close: $0.1725
Based on my DTT analysis, move is likely to dump down more before another potential continuation to the upside.

Move | Long TVC:MOVE remains bullish. Entry 1 and Entry 2 have already been triggered, and Entry 3 is close to being activated. If Entry 3 is triggered, we could potentially see a parabolic bounce from this level, as it aligns with the 0.618 Fibonacci retracement—a key zone for strong reversals.

$MOVE Setup Looks Clean – Support Holding Strong!!TVC:MOVE busted out of the downtrend and is currently testing the resistance trendline as a support line✅
Price is remaining at the level of the 0.236 Fib and resting on a pivotal area the retest has the potential to prepare the ground for the next leg up to $0.24+.
DYOR, NFA

Long Signal Entry: Initiate a long position at $0.25388 after the breakout confirmation is established.
Targets: Refer to the chart for identified target levels.
Invalidation: Signal is invalid if price closes below $0.15.

Move pump to $0.18#moveusdt long.
🎯Target: $0.18
💰Roughly 3RR
Member in crypto Wallstreet brought this pair to my attention. Used DTT process to assess it. Approved ✅

MOVE : Where to buy ?Hello friends
Given the upcoming token release, the price is expected to continue to fall, so be careful.
In case of a fall, we have identified important support levels for you, where you can buy with capital and risk management.
*Trade safely with us*

MOVEUSDT.P LONGI think the price will jump from here.
Looking to book 75% at first tp.
Risky trade as btc not looking so good.
But this coin may pump.
Lets hope for the best.
DYOR

MOVE is nose diving... Do we buy the dip?TVC:MOVE price doesn't look good if one were to take the risk here; market structure needs to develop. Consider risk-to-reward ratio before considering this asset for your portfolio.
Full TA: Link in the BIO

WOWDue to another delay in airdrops and feedback from the community, it seems all these reviews have led to coinbase planning to delist. Within 2 minutes! It dropped about 20%. This is a sale of approximately $1.3 million worth of tokens.
This is the definition of rug pulling compliments of your local Centralised exchange.
It is looking like the end for Movement Labz, unless the network can provide some much needed utility and a miracle.
Market sentiment moves markets, and yours is not great!
Target... $1 000 000 000! LMAO 🤣
Will be happy with £1 or any green going forward.
@Dyl_uk

MOVE hughe FW breakout incomming?MOVE has been dropping over 80% from it's ATH.
This looks like bearmarket scenario's. But as I did mention before in other posts. This bull cycle is different and especially for ALTCOINS. The massive growth in number of ALTS makes it hard to stand out and gain momentum. The money and social attention is widely spread over milions of coins now. The 1875 active accounts holding MOVE is reasonable for a relative new project jet it doesn't signal mass adoption.
MOVE is a Layer1 / 2 and ZK coin in the smart contracts. It's also in the World Liberty Financial portfoilio and made in the USA. These fundamentals are bullisch for MOVE. A breakout from the FW pattern could make it take off at rocket pace towards the former highs.
Allong the way we can see and identify several major S/R line that have to be broken first.
Indicators:
The rounded bottom / consolidation could mark the bottom.
Stoch indicator: The STOCH shows signs of recovery
Golden Cross: The short term MA has been crossing the Long term MA signaling recovery.
Volume: The low volume is typical for the consolidation.
CONSOLIDATION above support and below resistance
The level where we find MOVE right now looks like consolidation and bottom possibility. With support at 0,218 a small resistance at 0,34 and a major resistance at 0,56.
My trading plan for now:
I will open a new bigger SPOT position in order to lower my AVG ENTRY that has lost over 60% in the last months. A run up from this level to the S/R level 0,56 means a 177% profit.

Due for reversal!Showing support on the Fib. Multiple trend lines forming a giant arrow. Not sure this what this pattern is called. Points to a pivot point maybe. Now it's up to the team to build and be serious. Utility.
Discount zone on the Daily and 4hr. Bottoms in?
NFA. DYOR.
Entry Now!
TP rationale!
@Dyl_uk


move +target 1.82 🤑
buy and wait to full target !
movment futures shine
buy and wait for this coin .
