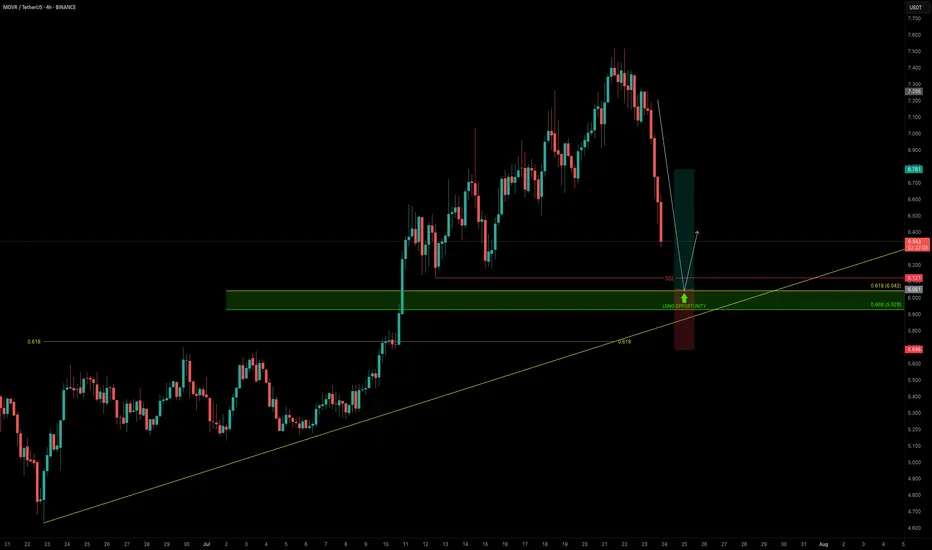
MOVR — Buying the Dip Into Confluence SupportAs the broader market pulls back, it’s the perfect time to scan for high-conviction long setups — and MOVR stands out.
Price is approaching a strong confluence support zone, offering a solid long opportunity.
🧩 Key Technicals
➡️ Liquidity Pool Below the Low:
There’s a visible liquidity pocket just beneath the swing low at $6.121 — an area where stop hunts and reversals are likely.
➡️ Fib & Speed Fan Confluence:
0.618 Fib retracement from the recent move aligns at $6.042
0.618 Speed Fan level also intersects the zone
Together, they form a technical floor right at the $6 psychological level
🟢 Long Trade Setup
Entry: $6.042
Stop-loss: $5.685 (below structure & liquidity sweep)
Target (TP): $6.78
R:R: ≈ 1:2+
Plan: Wait for price to fill into the zone and monitor for a bullish reaction (e.g., SFP, bullish structure reclaim)
💡 Why It Matters: Confluence Builds Confidence
When multiple tools — fib retracement, speed fan, liquidity pools, and psychological round numbers — all line up, it increases the probability of a strong reaction.
This is how smart money builds positions — not by chasing pumps, but by entering where others panic.
Final Thoughts
MOVR is approaching a clean, high-probability buy zone just below $6.00.
If the level holds and confirms with price action, this setup offers a solid R:R and a clear invalidation point.
📌 Mark the zone, set your alert, and let price come to you.
_________________________________
💬 If you found this helpful, drop a like and comment!
Want breakdowns of other charts? Leave your requests below.
MOVRUSDT trade ideas
MOVR (SPOT)BINANCE:MOVRUSDT
#MOVR/ USDT
Entry (5.000- 5.700)
***** (Wait for the price to come to the entry range & price may come to the lowest entry point ) ******
SL 4H close below 4.900
T1 7.00
T2 9.50
T3 12.00
Extra Target
T4 13.50
_______________________________________________________
Golden Advices.
********************
* collect the coin slowly in the entry range.
* Please calculate your losses before the entry.
* Do not enter any trade you find it not suitable for you.
* No FOMO - No Rush , it is a long journey.

MOVR | Flag PatternFlag pattern is about te break out level, after confirmed break out in daily timeframe, expecting 50% bullish wave

MOVRUSDT – Bullish Momentum Building on Daily ChartMOVRUSDT – Bullish Momentum Building on Daily Chart
The daily chart is indicating short-term upward momentum, supported by a bullish crossover of the 50-day and 200-day SMAs on the 4-hour timeframe. RSI is hovering around 74, showing strong buying pressure without being extremely overbought. MACD is bullish, and price action is pressing against key resistance at $7.50. A breakout above this level with strong volume could trigger the next leg up toward $8.00 and beyond. Watch for consolidation between $7.00–$7.50 as a potential accumulation zone.

Moonriver 331% Profits Potential Target Mapped (Volume Breakout)Moonriver today produced the highest volume daily since December 2024. The big difference between now and then lies in the fact that in December MOVRUSDT was trading near a peak while today it is coming out of a higher low. Increasing volume in this situation means the start of something positive for the bulls.
For example, last year after some bearish action the first high volume candle came in October. After some choppy action, we experienced a strong bullish wave.
So now we have high volume today and this is only the start. We will see grow and more volume and bullish momentum building up... It will all accumulate and culminate in a massive bull run.
Thanks a lot for your continued support.
Namaste.

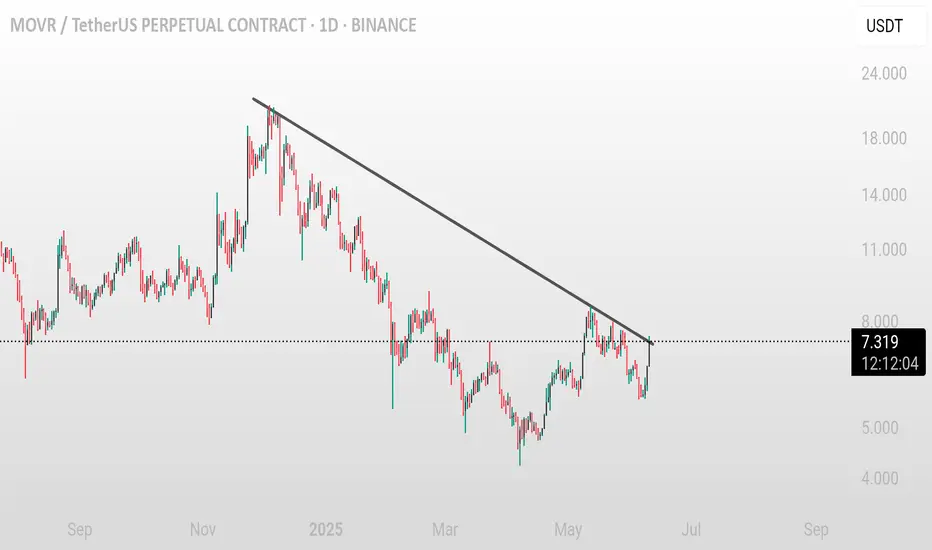
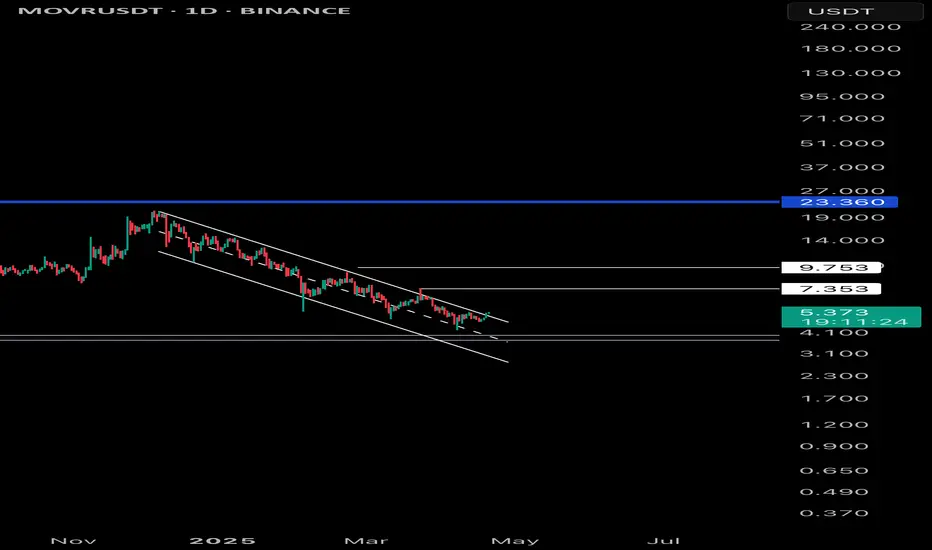
MOVR/USDT (1D) – Trendline Breakout Setup Incoming MOVR/USDT (1D) – Trendline Breakout Setup Incoming
Pattern: Downtrend Breakout 📈
Timeframe: 1-Day ⏱️
Pair: MOVR/USDT 💱
Published: June 10, 2025 📅
Technical Overview:
MOVR/USDT has been trading under a clear downward trendline, forming lower highs over an extended period. The price is now approaching this resistance, showing early signs of momentum shift.
A confirmed daily candle close above the trendline could trigger a bullish breakout and a potential trend reversal 🔥
Potential Trade Setup:
Bullish Scenario ✅
Entry: On breakout and strong daily close above 7.50–7.60
Targets:
* First target at 8.50–9.00 🎯
* Second target at 10.50–11.00 🎯
Stop-loss: Below 6.80–7.00 🛑
Risk Management ⚠️
Watch for volume confirmation to avoid fakeouts. If price gets rejected, it may consolidate or revisit lower support.
Conclusion:
MOVR is at a critical resistance zone. Breakout could open room for strong upside. Let the market confirm before entering 📊🔍
MOVR LONG SETUP ALL trading ideas have entry point + stop loss + take profit + Risk level.
hello Traders, here is the full analysis for this pair, let me know in the comment section below if you have any questions, the entry will be taken only if all rules of the strategies will be satisfied. I suggest you keep this pair on your watchlist and see if the rules of your strategy are satisfied. Please also refer to the Important Risk Notice linked below.
Disclaimer

Moonriver Short-Term Boom 128% PP & 390% Mid-Term (You Choose)I am sharing Moonriver as a short-term trade setup but this doesn't invalidate the long-term potential. It will grow strong with the rest of the market but here is a fast target.
A "fast target" based on the fact that we have a bullish flag on the chart. The bull-flag is a continuation signal which means higher prices in the coming weeks and days.
Now, remember, the market can change course but if this happens the bullish bias is not invalidated rather we wait. If prices move down first before additional growth this is nothing other than some noise, a market shakeout before additional growth.
The bias is bullish, the signals are bullish and this means we are going up.
The main target for the short-term is a nice double-up. Whatever money you put in it can more than double if-when the target hits.
If there is a drop support will be found at the 3-Feb or 11-March low support. I am not betting on the low, but we need to be prepared.
Aim high, you got this. This is another easy chart. Remember Kaito?
Oh yes... We are bullish now and this is only the start.
The entire Cryptocurrency market will be extremely bullish by late May.
Prediction confirmed, success.
Thank you for reading.
Namaste.

MOVRUSDT 1D AnalysisMOVR ~ 1D Analysis
#MOVR Buy when re -testing this support block with a short -term target of at least 10%+
MOVRUSDT IS READY?1. Bullish Scenario (Breakout to the Upside):
• If the price closes daily above 5.60 or 5.80 with strong momentum, it would confirm a breakout from the descending channel.
• The next potential target could be in the range of 6.20 – 6.50.
2. Bearish Scenario (Rejection from the Upper Channel):
• If the price fails to break above 5.60 and gets rejected from the upper trendline, it may pull back to test support levels around 5.00 – 4.85.
#MOVR/USDT#MOVR
The price is moving within a descending channel on the 1-hour frame, adhering well to it, and is heading for a strong breakout and retest.
We are experiencing a rebound from the lower boundary of the descending channel, which is support at 4.70.
We are experiencing a downtrend on the RSI indicator, which is about to break and retest, supporting the upward trend.
We are looking for stability above the 100 moving average.
Entry price: 4.80
First target: 4.90
Second target: 5.0
Third target: 5.12

MOVRUSDThi all
MOVR is bottom of it's price level, liquidity in higher zones, & ichimuko system is OK...
we open a trader on it...

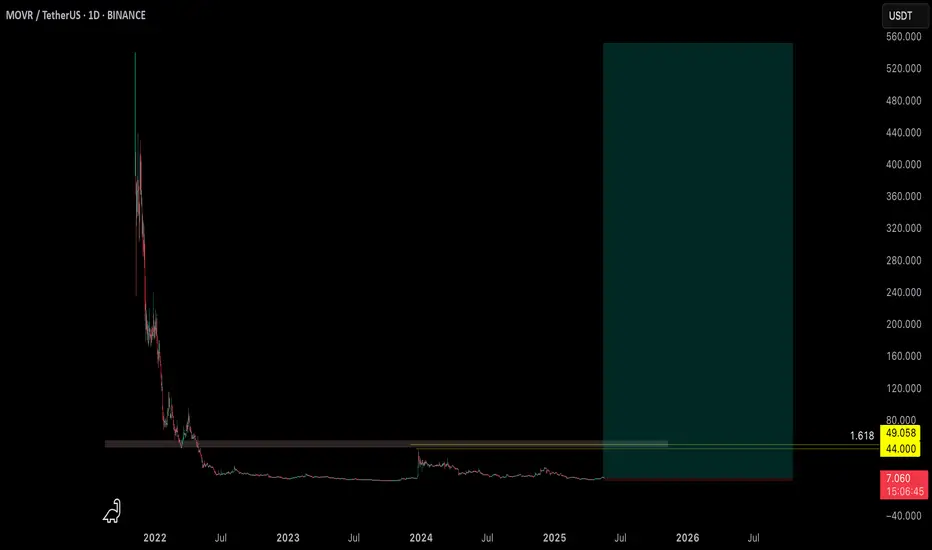
Moonriver: Your Altcoin ChoiceHere Moonriver produced growth equaling 1,000% in a down year, 11X. Between late 2023 and early 2024. Surely, if this pair can produce this much growth as part of a bounce, a small move lasting two months within a bearish period, it can definitely grow more in a bull market. Any type of bull market.
Following this logic, a bull market year can produce a minimum of 2,000% or 3,000%, or maybe more, 5,000%, because the 1,000% was when the market was down and at its worst. And this all happened within 2 months.
So two months can produce 1,000% growth. Six months can surely produce so much more. This is logical thinking, makes sense and I believe you can agree.
Imagine the market going full blown bullish but producing the exact same amount of growth as in a neutral year, 1,000%. This would still be great but it doesn't make any sense.
Moonriver (MOVRUSDT) is trading at bottom prices with a long-term higher low (technical double-bottom), ready to grow. 2025 is the Cryptocurrency bull market year, we will see a minimum of 21X, but this pair can grow much more.
This another great Altcoin Choice.
Make sure to secure profits as your capital grows.
We are entering the 2025 bull market this or next month. The growth starts now, slowly, by next month everything will speed up. The wait is over. Rest easy, the pair you are holding is good with good potential for growth. Really strong. Your wise. You are smart.
Thanks a lot for your continued support.
Namaste.

MOVRUSDT 2DMOVR ~ 2D Analysis
#MOVR Buy when re -testing this support or buy after successfully penetrating this resistant line. Minimum target of 15%+.

Movr so bullish Moonriver chart so bullish
Expect huge trade soon
It's now showing a strong signal for uptrend
First tip 20$
Second tip 40$
Bounce tips 80$ and 120$ ( peak of Altcoin season)
CRYPTOCAP:BTC CRYPTOCAP:ETH CRYPTOCAP:DOT CRYPTOCAP:XRP CRYPTOCAP:BNB TVC:MOVE NASDAQ:OP

MOVRUSDT – Simple Trade, No Need for Big Risk! “Sharp moves, unpredictable price action—this one screams ‘shitcoin vibes’ but we trade with a plan, not emotions.”
🔥 Key Insights:
✅ Clean Setup – If price reacts from my levels, it’s a straightforward trade. No need for overcomplication.
✅ Controlled Risk – No reckless sizing here. Calculated risk = long-term success.
✅ Sharp Movements = Caution – Sudden spikes, erratic price action—this is where patience beats impulsive trading.
💡 How I’m Approaching This Trade Like a Pro:
LTF Confirmation Required – I won’t just enter blindly. Volume profile, CDV & LTF structure must align.
If It Moves Too Wildly? I’ll step aside—choppy shitcoins eat accounts. Risk management comes first.
No Overexposure – This is just one trade, not a lottery ticket. Play smart, not desperate.
📉 Final Thought:
Shitcoins can be goldmines or traps. The difference? Smart execution & discipline. Follow me if you’re done with gambling and ready to trade like a pro. 🚀🔥
A tiny part of my runners;
💼 STMXUSDT: 2 Buying Areas
🐢 TURBOUSDT: Buy Zones and Buyer Presence
🌍 ICPUSDT.P: Massive Upside Potential | Check the Trade Update For Seeing Results
🟠 IDEXUSDT: Spot Buy Area | %26 Profit if You Trade with MSB
📌 USUALUSDT: Buyers Are Active + %70 Profit in Total
🌟 FORTHUSDT: Sniper Entry +%26 Reaction
🐳 QKCUSDT: Sniper Entry +%57 Reaction
j
A tiny part of my runners:
🎯 ZENUSDT.P: Patience & Profitability | %230 Reaction from the Sniper Entry
🐶 DOGEUSDT.P: Next Move
🎨 RENDERUSDT.P: Opportunity of the Month
💎 ETHUSDT.P: Where to Retrace
🟢 BNBUSDT.P: Potential Surge
📊 BTC Dominance: Reaction Zone
🌊 WAVESUSDT.P: Demand Zone Potential
🟣 UNIUSDT.P: Long-Term Trade
🔵 XRPUSDT.P: Entry Zones
🔗 LINKUSDT.P: Follow The River
📈 BTCUSDT.P: Two Key Demand Zones
🟩 POLUSDT: Bullish Momentum
🌟 PENDLEUSDT.P: Where Opportunity Meets Precision
🔥 BTCUSDT.P: Liquidation of Highly Leveraged Longs
🌊 SOLUSDT.P: SOL's Dip - Your Opportunity
🐸 1000PEPEUSDT.P: Prime Bounce Zone Unlocked
🚀 ETHUSDT.P: Set to Explode - Don't Miss This Game Changer
🤖 IQUSDT: Smart Plan
⚡️ PONDUSDT: A Trade Not Taken Is Better Than a Losing One
💼 STMXUSDT: 2 Buying Areas
🐢 TURBOUSDT: Buy Zones and Buyer Presence
🌍 ICPUSDT.P: Massive Upside Potential | Check the Trade Update For Seeing Results
🟠 IDEXUSDT: Spot Buy Area | %26 Profit if You Trade with MSB
📌 USUALUSDT: Buyers Are Active + %70 Profit in Total
🌟 FORTHUSDT: Sniper Entry +%26 Reaction
🐳 QKCUSDT: Sniper Entry +%57 Reaction
📊 BTC.D: Retest of Key Area Highly Likely
I stopped adding to the list because it's kinda tiring to add 5-10 charts in every move but you can check my profile and see that it goes on..

#MOVR/USDT#MOVR
The price is moving within a descending channel on the 1-hour frame, adhering well to it, and is heading for a strong breakout and retest.
We are seeing a bounce from the lower boundary of the descending channel, which is support at 4.93.
We have a downtrend on the RSI indicator that is about to be broken and retested, supporting the upward trend.
We are looking for stability above the 100 Moving Average.
Entry price: 5.65
First target: 6.14
Second target: 6.60
Third target: 7.08

MOVRUSDT 5DMOVR ~ 5D Analysis
#MOVR Support blocks are very good for now. Buy gradually from here, with a short -term target of at least 20%+

MOVR Long Setup📍 Crypto SIGNAL #📍
COIN: $MOVR/USDT (5x-15x)
Direction: LONG 📈
➖➖➖➖➖➖➖
➡️ Entry : 7.2 - 8.15
🔰 Targets
🎯 Short Term :
🎯 Target 1 - 8.39
🎯 Target 2 -8.49
🎯 Target 3 - 8.61
🎯 Target 4 - 8.8
🎯 Mid-Term :
🎯 Target 5 - 9
🎯 Target 6 - 9.2
🎯 Target 7 - 9.5
🎯 Target 8 - 10
🎯 Long Term :
🎯 Target 9- 12
🎯 Target 10 - 18
❌ Invalid Level : 6.5
➖➖➖➖➖➖➖
#SRFXTEAM💻

MOVR on 12H chartBINANCE:MOVRUSDT
We have a rebound from a previous low, and also an exit from a downtrend with a retest of the trend line, and we also have positive divergence.
If there is no change in the market, I think it will move soon.
This is just an opinion about the currency and is not considered investment advice.
Your decision is your responsibility ..

Alikze »» MOVR | Supercycle Bullish Wave 3 or C Scenario - 1D🔍 Technical analysis: Super cycle Bullish Wave 3 or C Scenario - 1D
📣 MEXC:MOVRUSDT currency has encountered demand after a zigzag correction in the 3.61 range, which has had a rapid upward rally
🟢 After that, the price has had a double complex zigzag correction to the origin of the third upward wave.
🟢 Again, in the origin of the third movement, with a three-wave movement, it has encountered demand again in the area of the bottom of the ascending channel.
🟢 Currently, selling pressure is also observed in the ceiling of the ascending channel and the supply area.
💎 If this correction is broken in the form of a zigzag to the minor ceiling, it can be extended to the minor ceiling. It can again encounter demand and an upward rally to the minor ceiling of the previous rally.
💎 Depending on the momentum, this cycle can be a super cycle wave 3 or C to touch the red box area.
⚠️In addition, if the area touches the bottom of the previous wave, the bullish scenario is invalidated and should be re-examined and updated.⚠️
»»»«««»»»«««»»»«««
Please support this idea 💡 with a LIKE 👍 and COMMENT 💬 if you find it useful and Click "Follow" on our profile if you'd like these trade ideas delivered straight to your email 📧 in the future.
🙏Thanks for your continued support.
Best Regards,❤️
Alikze.
»»»«««»»»«««»»»«««

SPOT MOVR LONG 14.01.2025Pinning after containment of sales.
🎯Purpose:
13.482
I'll let you know when I record it manually.
‼️Risk per trade: 1% of the allocated funds for spot trading.
Thank you for follow and the reaction🚀.
