the price is in the uptrendGiven the positive price conditions, the price is in the uptrend, and then the gaza should wait for the long -term trend line to achieve at least its previous roof.
MTCUSD trade ideas
MATICUSD Bullish OutlookHi
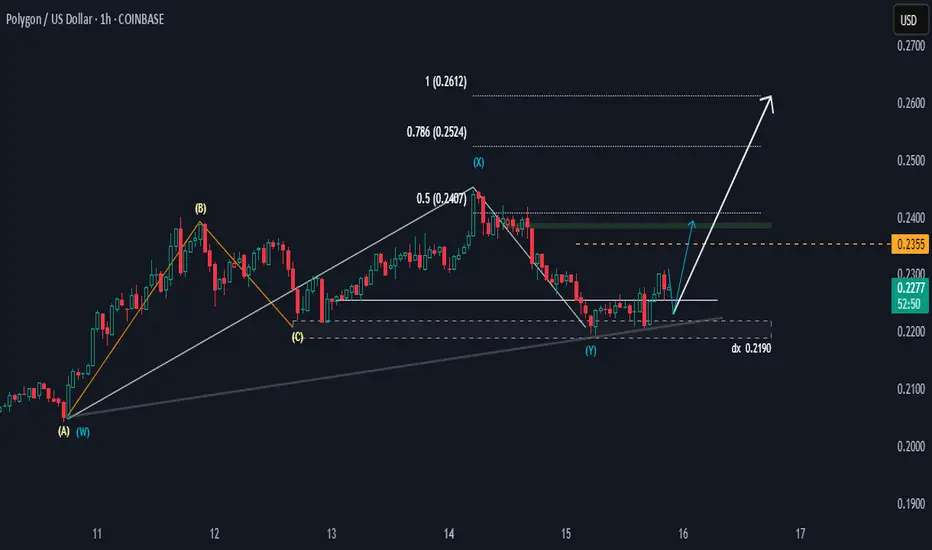
MATICUSD is likely to pulse down and push up to 0.2355 for a bias of 0.2355.
We could also see a price rally up to 0.2524 and 0.2612, provided the 0.2190 holds; if not, then the setup will be invalid.
Happy trading,
K.
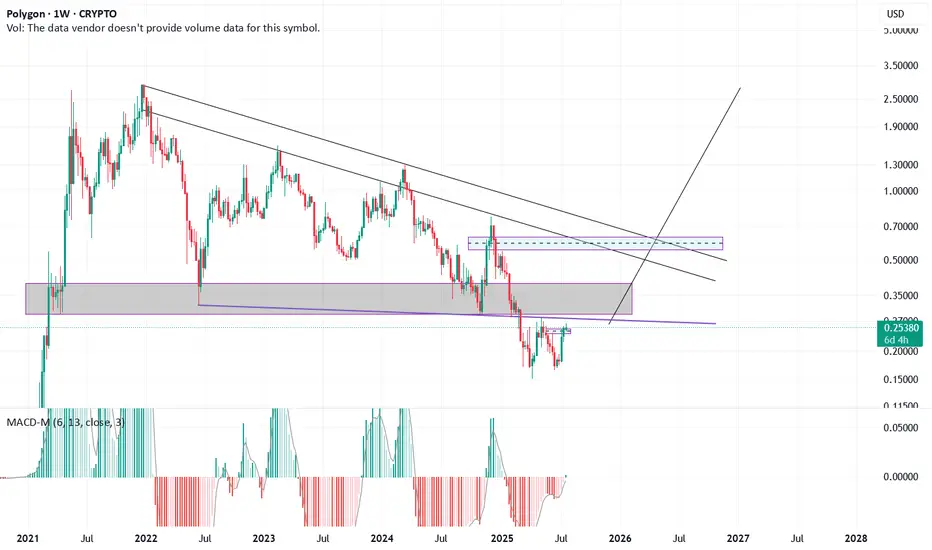
Easy 100% gainsI estimate that soon levels around 0.50$ will be reached and challenged, if it breaks than 0.7$ to 1.0$ are next to come.

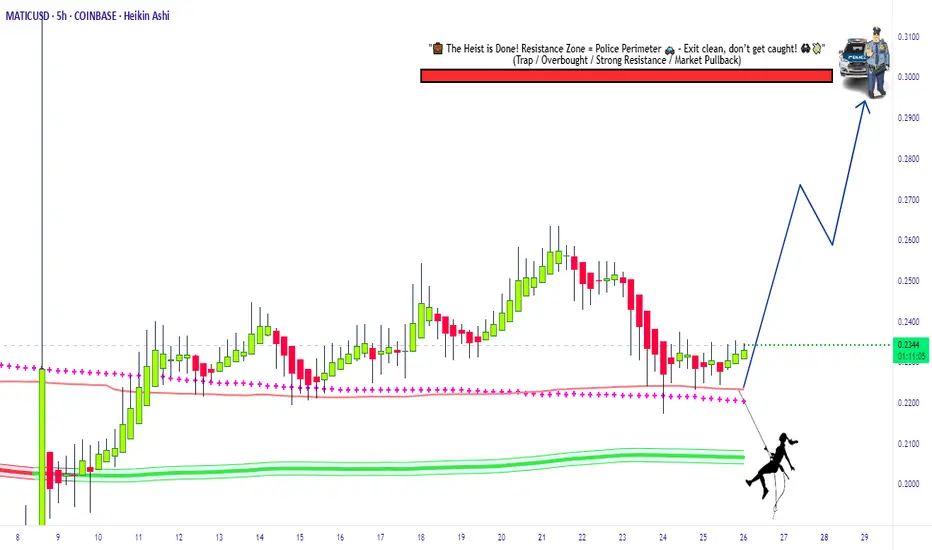
Swipe the Polygon Vault MATIC/USDT Bullish Heist Strategy🔥 MATIC/USDT Heist Plan: Swipe the Loot Before the Cops Clock In! 🏴☠️💸
🌍 Oi! Hola! Bonjour! Hallo! Marhaba!
💼 Welcome back, Money Makers & Market Bandits!
The Polygon (MATIC) vs Tether vault is wide open! Based on our 🔍 Thief Trading Style Analysis, it's time to plan the ultimate crypto chart robbery with a long-side assault on this bullish breakout. 📈💥
💣 Robbery Blueprint – The MATIC/USDT Master Plan
🚪 ENTRY STRATEGY: Get In, Get Rich, Get Out!
⚡ Vault Breach: Enter LONG at market price if you're bold & fast.
🎯 Smart Entry: Wait for price pullbacks on 15m/30m swing lows/highs.
💎 Use layered DCA-style orders for clean risk-controlled entries.
Thieves don’t rush—they snipe the perfect price levels.
🛑 ESCAPE PLAN: Stop Loss Strategy
📍 SL placed at: 0.2000 (based on 4H candle wick zone).
💡 Adjust SL to your loot capacity (risk, lot size, number of orders).
⚠️ If price dips near SL, that’s the cops knocking—bail fast or go down swingin’.
🎯 TARGETS: Stack Your Bags Before the Alarm Rings
🚀 Primary Target: 0.3000
🧲 Scalpers: Grab & Go! Stick to long bias only. Use trailing SL to protect the gains.
🎩 Swing Robbers: Hold strong. Watch for resistance traps & trailing stops near key zones.
📊 Market Intel: Why This Heist Has High Odds 🎯
🔋 Bullish pressure building with growing momentum.
📡 Supporting Data:
🔍 On-chain metrics signaling accumulation
💼 Macro sentiment favoring risk assets
🧠 COT reports + intermarket analysis leaning bullish
Just don’t get comfy—this is a heist, not a honeymoon!
🚨 Trade Warning – Don’t Get Caught!
📢 Major News Releases = High Volatility.
🚫 Avoid fresh trades during key announcements.
🔒 Use trailing SL to lock in profits & escape clean.
💥 Like, Follow & Power Up the Robbery Squad 💥
💬 Support the crew. Hit BOOST to keep these trade ideas flying.
Your thumbs-up fuels the next chart breach. 💪
📡 Stay locked in—more heist setups coming soon!
🎯 Trade Sharp. Swipe Smart. Escape Fast. 🏴☠️
Thief Trader Out. 🐱👤💰
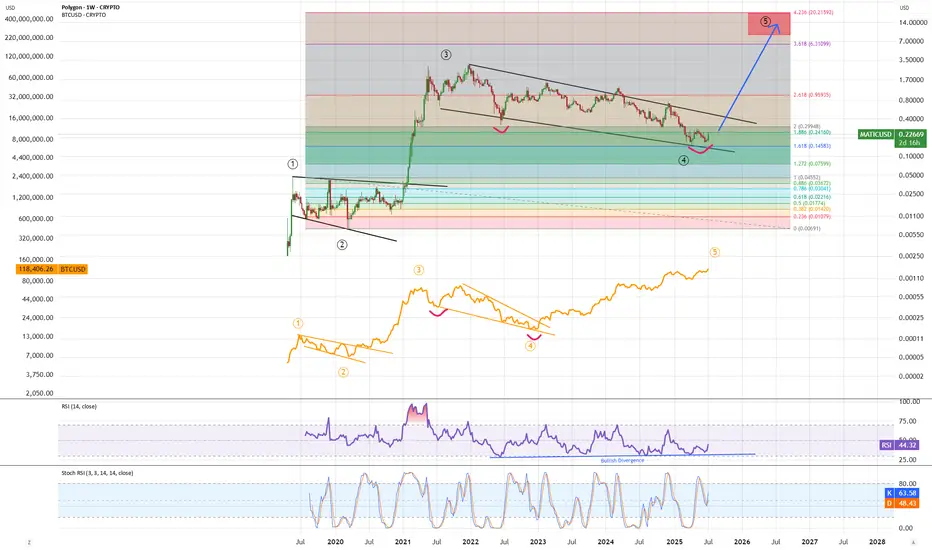
MATIC - time for impulse to new ATH!MATIC is doing same moves as BTC did just with a lag. We are oversold with bullish divergence in a falling wedge formation. Just like BTC did I expect Matic to breakout of falling wedge formation and push to new ATH for blowoff top - after that likely correction back to current level so make sure to secure profits on time.
Is MATIC Nearing a Bottom or More Downside Ahead ?
Lower Highs & Lower Lows: The price consistently prints lower highs and lower lows, confirming a bearish structure.
The price is moving along the lower band, indicating persistent bearish pressure.
The middle band (moving average) is acting as a resistance level.
Support: Around $0.20 - $0.21 (current price zone), as it appears to be stabilizing near the lower Bollinger Band.
Resistance: Near $0.28 - $0.30 (middle Bollinger Band) and a stronger resistance at $0.35.
Volume has been relatively low, suggesting weak buying interest.
If $0.20 breaks down, the next strong support might be around $0.15.

MATICUSD Looking BullishHello,
MATICUSD appears overall bullish on the H1 timeframe. Currently, the price seems to be stretching toward the 0.2355 resistance zone, which could lead to a potential bullish pullback.
The resistance at 0.2389 appears significant, with its opposite lower highs, suggesting some attention in those areas.
The 0.2431 level is the desired price target, with a bias toward 0.2485. The price setup is supported by the 0.2258 level, with additional support at 0.2232 and the support area zone around 0.2196.
Happy Trading,
K.
Not trading advice

Matic a.k.a Pol.. Could this be the moment?This is not a buy vall, just sharing the chart from my point of view.
Risk is yours, as always. Trade smart.
~TheChartMystic~

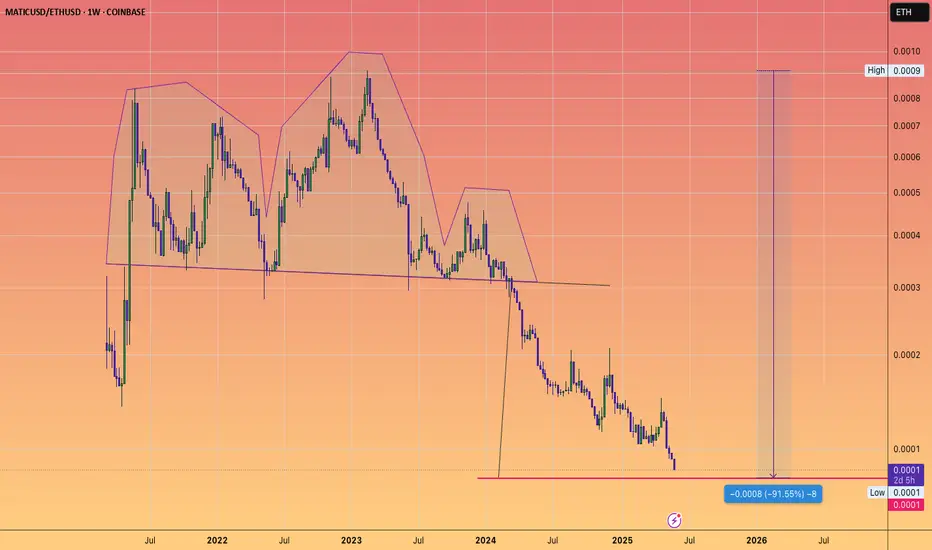
MATIC approaching Head and shoulders target...versus ETH
which would be a -91% loss of value versus the second most important crypto
nice buy opportunity for matic (polygan)we are facing the great support area around 0.21 if the paterns close at 0.23 by the end of the week we are going to have nice 30% rise


Polygon's Comeback!#Polygon, a leader of the Ethereum ecosystem since 2019, shows signs of a major comeback after its recent bounce.
Maintaining $0.15 keeps the bullish case valid. Passing $0.28 is the first confirmation, while clearing $0.77 paves the way to target the ATH.
#Matic

MATICUSD - Resistance Flipped SupportSupport has been found along the 200MA on this 4HR chart
This line has previously been seen as an area of strong resistance but now its showing signs of support
This is a sign of further movement up on this 4Hr timeframe

MATICUSD - LongBuy entry at 0,2108 USD with a stop loss at 0,1482 USD.
Profit taking at: 0,3797 USD, 0,7572 USD and 1,2 USD.

XRP, MATIC, SHIB XRP projected significantly higher after crossing "the point of no return" hitting the first target. Both MATIC and SHIB are forming patterns resembling that of XRP. I believe like XRP, MATIC and SHIB will cross "the point of no return" and hit their first targets which are their all time high's.

Elliot wave corrective ABC Triangle pattern Wave A is an impulsive wave that 5 subdivisions. Wave B is an abcde triangle and each wave has 3 subdivisios. a-b of the triangle is connected by wxy (also has 3 subdivisions each).
Look at smaller time frame to see (and confirm structure). Currently looking out for wave d of the triangle (wave 1 of 3) to complete then followed wave e 3 waves in the opposite direction, before there can be any break-out.
This is only an idea not financial advice

MaticIm just seeing opportunities to go long on good value tokens.
None of this is financial advice, im just pointing out that if you are patient and know what you are looking for then the right times to trade are easy to spot.
my long strat has triggered

POL: The Return of The Matic#POL recently bounced in what could be a bullish reversal, possibly marking the end of a 3-year corrective major wave (4).
If the $0.151 low holds (stop-loss), a massive bull run shall start for #MATIC.
Passing $0.768 confirms the bullish idea of targeting the ATH.
#Polygon

MATICUSD - Weekly MACD Turning GreenFinally the MACD is coming around to the bull side on this Weekly timeframe
This is an indicator that a bull rally is coming out of this deep bear market we have seen
Bullish!

Auto-Matic?I'm not sure how this is going to play out...I haven't really found where support is for this pair but I have a hunch that it is time for Matic to climb possibly to a new all time high. When? I'm not sure how the alt coins will maneuver this bull cycle but I am invested.

Bounce or New lowsMATIC had a hard drop from .75 to .15 cents, ouch. Now it seems it may be consolidating again in a parallel channel but if it breaks below, it sadly will make new lows, we need price to break out above the channel .1938 and make higher highs and higher lows. Anything below .1519 is in the danger zone. The Stochastic RSI and RSI and CCI are both in the oversold zones and the bottom indicator is flashing. Please be careful and have a nice day

MATIC up ideaan idea suggesting a bull run for matic
matic has been in the bears control for quite awhile
Perhaps it will reverse strongly?
Breakout of channel possible
Weekly timeframe

long pol Given that after a strong trend, the price has been declining for about four years, we are slowly entering a new trend. I expect a price of $5 to end this cycle, which will bring the market cap to $50 billion.
