What was the impact of Grayscale's decision to remove Polygon?The Impact of Grayscale's Fund Rebalancing In a surprising change of events, Grayscale has pulled Polygon (MATIC), a $8 billion crypto project, from its Digital Large Cap Fund. The decision was stated in a recent news release in which the corporation reported its most recent fund rebalance. Grayscale's move to sell off portions of the fund's present components depending on their weightings has had a substantial impact on Polygon (MATIC), which was excluded as a result.
MTCUSD trade ideas

Polygon Going up in a channel? (Currently at Bottom)Seems Clear, will it outperform Solana? It could also break down from here cause it has several hits in this channel already on both ends and near the middle...

MATIC/USD 3d Breakout !MATIC/USD 3d Breakout
#matic
#polygon
>We see repeated construction on a larger scale.
An analogue of the 1-6 movement has arrived.
It took place to the upside with an inverted shoulder-head-shoulder pattern.
Continue !!..
MATIC/USD 1w chart

Polygon MATIC 2024 Price PredictionTLDR:
My 2024 targets from low to high are:
1. 1.92 USDT, the 0.618 Fib retracement.
2. 2.36 USDT, the 0.786 Fib retracement.
3. 2.57 USDT, 400% from the recent HL on the weekly TF.
4. 2.92 USDT, the 2/1 Gann angle (considering price and time).
Background (Weekly TF):
Matic was in a downtrend from December 2021 until June 2022. MATIC lost 89.54% of its USDT value during the downtrend, which is remarkably good for a cryptocurrency.
Between June 2022 and February 2023, MATIC’s price rose approximately 400%, not too bad for a bear market.
From February 2023 until October 2023, MATIC was in a correction. MATIC managed to finish this correction with a HL of 0.49 cents. This means that MATIC maintained the uptrend and completed the overall correction with a Double Bottom.
Support and Resistance (Weekly TF):
MATIC is above the 0.236 Fibonacci retracement at approximately 93 cents. It is yet unclear if it will hold this level or not. MATIC is 99% correlated to Bitcoin, and much depends on Bitcoin’s PA, which is unclear.
The next significant resistance is the 0.382 Fibonacci retracement at 1.30 USDT. A Weekly supply zone compounds this resistance. This zone’s proximal line is at 1.28 USDT, and the distal line is at 1.5 USDT.
The 4/1 Gann angle is also approximately at the same level, strengthening the resistance level. Unlike Fib retracements, which are horizontal, a Gann angle is diagonal and considers price and time. For this reason, I cannot put a number on this resistance.
Volume Profile:
Fixed Range Volume Profile taken from December 2021 until today shows the PoC is at the same level as the 0.236 Fib retracement. If MATIC manages to hold above this level, it could become a significant support level. The VAH is at 1.08 USDT, acting as resistance on the daily TF.
A Fixed Range Volume Profile taken from the bear market low shows the PoC is at 85 cents. From a PA standpoint, the 85 cent is a notable S/R level. Should MATIC lose the 92-cent level, the 85-cent level could be appointed in which MATIC will find support and turn around.
2024 Targets:
Predictions are a thorny issue. What I am doing as an analyst is driving forward while looking in the rearview mirror. Take my prediction as an educated guess and always trade the chart level to level.
I assume 2024 will be a good year for crypto because of macro factors such as the Bitcoin ETF, the US FED rate cuts, and the presidential election race.
MATIC has proven itself to be a resilient and volatile asset, which makes me optimistic about its prospects. MATIC managed to rise 400% in eight months during a bear market. Assuming the same level of performance in a bull market is conservative.
My 2024 targets from low to high are:
1. 2.36 USDT, the 0.786 Fib retracement.
2. 2.57 USDT, 400% from the recent HL on the weekly TF.
3. 2.92 USDT, the 2/1 Gann angle (considering price and time).
What do you think?
Please share in the comments.

Short time frame Falling wedge on #MATICAs you are aware if u follow me
Matic is quite bullish on the big time frames.
& I expect it to exceed it's 2021 All time High
No mean feat for an Alt coin!
So when u spot bullish structures on the lower time frames
Could be a good idea to position yourself for upside
:) NFA

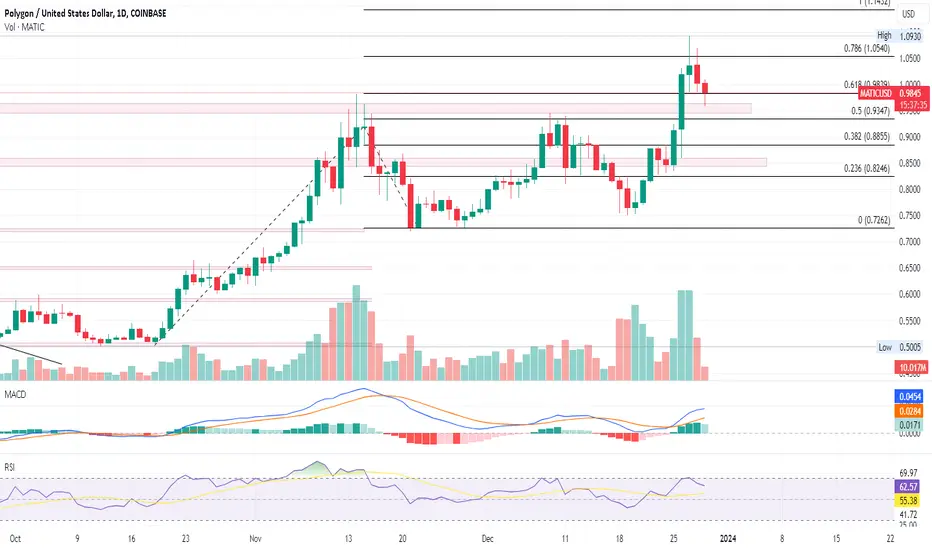
MATIC Price Analysis: Eyeing a Bullish SurgeCurrent Scenario: MATIC price is showcasing a bullish potential with a recent retest of the $0.96 breakout point.
Recent Performance: After a minor pullback, MATIC has rebounded, indicating a possible resurgence in bullish momentum.
Key Level: Overcoming the $1 barrier could solidify it as a strong support level, enhancing bullish prospects.
Market Sentiment: There's growing optimism for MATIC, with predictions of reaching as high as $2 in 2024.
Volume Analysis: The increase in trading volume alongside the price rebound suggests strong market interest.
Technical Resistance: Higher price rejection hints at substantial overhead resistance, potentially slowing the upward trajectory.
Double Bottom Breakout: The retest of $0.96 aligns with a double bottom breakout, bolstering bullish expectations.
Technical Indicators:
RSI: Indicates a possible turnaround with a move above the mid-line.
EMA: The golden crossover in the daily chart supports the bullish trend.
Price Targets: Following the Fibonacci extension, MATIC eyes potential levels of $1.20 and $1.50.
Risk Factors: A drop below the $0.96 range could escalate selling pressure, leading to a test of the $0.90 level.
Overall Outlook: MATIC’s current trajectory suggests a bullish trend, but market conditions and resistance levels will be key determinants.

MATIC Price Shows Potential for a 50% Rally in Early 2024Current Scenario: MATIC price recently experienced a bullish breakout but is currently undergoing a retest of the $0.96 level.
Recent Performance: After a strong 35% rise in just a week, MATIC's price struggles to maintain above the key $1 mark.
Retest Dynamics: The ongoing retest is characterized by lower price rejection, hinting at a possible successful retest.
Future Prospects: Post-retest, MATIC could potentially continue its bullish run, aiming for the $1.50 milestone.
Technical Snapshot: MATIC's price has shown resilience, bouncing back to $0.9855, limiting its intraday fall to 1.81%.
Volume Analysis: Reduced trading volume during the retest phase may augment the chances of a bullish reversal.
Technical Indicators:
MACD: Indicates sustained positive alignment despite a slight dip in bullish momentum.
EMAs: The bullish crossover between the 50-day and 200-day EMAs suggests potential dynamic support.
Fibonacci Levels: Trend-based Fibonacci extension points to possible targets at $1.20, followed by $1.50.
Downside Risks: A fall below the $0.96 level could amplify selling pressure, potentially testing the $0.90 mark.
Overall Outlook: The MATIC price analysis remains optimistic for early 2024, with signs pointing towards a significant rally if the current retest phase concludes successfully.
Can MATIC finally break the $1 and leave the penny Crypto area ❓Can MATIC finally break the $1 and leave the penny Crypto area for ever
Provided 2 charts for you:
no1
2-day candle chart shows nice bullish breakout👀‼️
no2 in Comments
The Renko chart shows that Polygon is at an important line🟩
If Polygon confirmes breakouts a huge bullish future is ahead IMO🚀
Comments💭, Likes♥️ & Follow🔗appreciated🤗
Disclaimer:
Not financial advice
Do your own research before investing
The content shared is for educational purposes only and is my personal opinion

MATICUSD One more correction left before going parabolic!It has been a little over 2 months since our last analysis on Polygon (MATICUSD), which eventually hit our 0.7000 target (see chart below) and has now broken above the 1W MA100 (green trend-line) for the first time since March 13 2023:
As you can see on this 1W time-frame, we are about to get a Bullish Cross between the 1W MA50 (blue trend-line) and the 1W MA100. That will be the first in MATIC history but we do not expect it to create the conditions for an immediate rally. Based on the same long Accumulation Phase of the previous Cycle, the rally started after the price broke below the 1W MA50 one last time.
Once that happens, we will turn bullish on MATIC again for the long term and target the 2.0 Fibonacci extension at 5.000.
-------------------------------------------------------------------------------
** Please LIKE 👍, FOLLOW ✅, SHARE 🙌 and COMMENT ✍ if you enjoy this idea! Also share your ideas and charts in the comments section below! This is best way to keep it relevant, support us, keep the content here free and allow the idea to reach as many people as possible. **
-------------------------------------------------------------------------------
💸💸💸💸💸💸
👇 👇 👇 👇 👇 👇

Polygon- an upside trending cryptoIt almost broke out with a nice volume. The symmetrical pattern has already formed where ABCD waves has completed. The last leg E has to go further down to a level of around $0.75-$0.69 from where the next rally begins.
The price has supported 200ma and 50ma. One of the good reason for the upside trend.
This is my only prediction. Not for trade. DYOR

REACCUMULATION FOR MATIC!The gains for MATIC can be huge.
After overcoming the weekly ichimoku baseline and taking it as support, MATIC should now go to higher levels.
The 1.618 level is already a 170% gain. Unless the pattern would become a distribution one, which right now does not seems to be, MATIC can really exploit.
The X.618 religion is back!

Polygon: The Token of Choice for Institutions !MATICUSDT is showing strong signs of bullish momentum and has the potential to reach significant new highs in the coming months.
Here are some of the key factors that support this bullish outlook:
MATICUSDT is breaking out of a long-term consolidation pattern. This suggests that the bulls are in control and that the price is likely to continue to move higher.
MATICUSDT is trading above all of its major moving averages. This is a classic sign of a bull market.
MATICUSDT is benefiting from strong fundamentals. Polygon is a leading Layer 2 scaling solution for Ethereum, and it is experiencing rapid growth in adoption.
Based on these factors, I believe that MATICUSDT is a good investment for the long term.
Here are some specific price targets to watch for:
Downside target: $0.69
Upside target: $ 1.69
Fair Value: $1.00
Please note that this is not financial advice and you should always do your own research before making any investment decisions.
I hope this information is helpful. Please let me know if you have any other questions.

Polygon matic longterm matrix - daylooking at the next couple of years within the matrix of the previous years.

Matic 1D - Wycoff Method - Phase D - December 2023Matic (Polygon) appears to be transitioning from phase D to the next stage, phase E, indicating potential upward movement. The notable increase in trading volume accompanying the rising price suggests a significant shift in the trend as we progress towards what could be a Sign of Strength (SOS).

matic is soon trading above a dollarinvalidation is monthly open, target is previous month high, 1 dollar, 1.05 and 1.1. very simple and obvious trade

Don't Sleep On Matic Once BTC starts to range, i am confident that the layer ones will take off. Matic is still way down from all time high. This is a great opportunity, the fundamentals are all there. Patience and timing will give off even more gains than 90%.

Matic Bullish (Adam & Eve) - Cup & Handle - Follows EthExtremely Bullish on Matic Here. A lot of bullish signs and based on previous markets Matic always has a strong showing after an ETH pump. With anything crypto related keep your stop losses tight and be ready for volatility. This market is bullish and will continue to be until proven otherwise. Safe Trading my friends

Bullrun in Polygon Incoming Cup and handle pattern forming up, I believe, that in upcomming weeks, we'll see a nice bull run up to 1£ +/- and if it brakes the resistance, we'll might see it climbing even more, aswell as moving averages climbing to cross.

Will MATIC Make A Comeback To $1? Triangle Breakout: RUNE price completes a bullish reversal, touching $6.5 after a triangle breakout rally.
Triple White Soldier: The daily chart reveals a triple white soldier pattern in the RUNE price action.
$10 Rally Potential: A breakout beyond $6.5 could trigger a rapid rally for RUNE, setting sights on the $10 mark.
Top Performer: Among this week's top performers, Thorchain's RUNE exhibits an impressive uptrend.
Yearly Surge: With a YTD growth of 194%, RUNE maintains bullish momentum into the close of 2023.
Continuation Pattern: The 4H chart displays a rounding bottom pattern, hinting at a potential breakout.
Current Trading: Presently traded at $6.36, showing a 21.20% surge in the last three days, forming the triple white soldier pattern.
Supportive Indicators: RSI reversal to overbought territory and strong EMA trends bolster the bullish sentiment for RUNE.

MATICUSD (4H) - Bullish reversalHi Traders
MATICUSD (4H Timeframe)
Waiting for the upward break of 0.7969 resistance level, which will complete a bullish trend reversal pattern to go LONG. Only the downward break of 0.7270 would cancel the bullish scenario.
Trade details
Entry: 0.7969
Stop loss: 0.7270
Take profit 1: 0.8386
Take profit 2: 0.9076
Score: 6
Strategy: Bullish reversal

Is Polygon (MATIC) Price About to Explode?MATIC price Action remains neutral, but there are some hidden signals that may lead to price spike.
The Polygon (MATIC) market has been presenting some intriguing signs that have caught the eye of vigilant investors. Recent activities suggest that there has been a silent accumulation of MATIC over the past two weeks, which often precedes significant price movement. With the price ranging during this period, the underlying question is whether MATIC is gearing up for an explosive move.
The price chart reveals that MATIC has indeed experienced a reversal after an unexpected and critical 21% drop. The market's response to this drop is crucial to understanding the future trajectory. Typically, after such a decline, savvy investors look for signs of accumulation as an indicator of potential upward momentum. This is due to the common market adage that "volume precedes price," suggesting that if accumulation is occurring, a price surge may be imminent.
An increase in volume accompanying the price range could indicate that investors are seeing value at these levels and are stepping in to buy, potentially setting the stage for a bullish trend. As seen on the daily MATIC/USDT chart, the volume profile is descending, which hints at a potential trend reversal in the foreseeable future.
Furthermore, we will be watching for a confirmed breakthrough on the charts. This would involve MATIC closing above a key resistance level on increased volume, which would lend credence to the theory that an explosive price movement is on the horizon.

#POLYGON #MATIC Long-Term targets, until end of 2025#POLYGON #MATIC Long-Term targets, until end of 2025
According to Elliott's wave count indicated on the chart, the rise from 2020 to 2021 took place during a five-wave, where either wave 1 is bigger than a five-wave or wave A is bigger than a three-wave.
Considering the possibilities ahead, we can estimate the possible goals of Link until the end of 2025 as follows:
TARGET1: 8$
TARGET2: 24$
TARGTE3: 48$
TARGET4: 145$
ENTRY: 0.85-0.60$
STOPLOSS: 0.50$

Going Long Matic here to 90 Cents PlusThis looks to be good support here for Matic. I have waited patiently for entry and .74 cents looks to be as good as any with all SMAs (50,100,200 day) on the underside for support along with a significant level. Also, RSI has reached support in conjuction with the pullback here. I will be taking profits along the way and expect to be out 75% by the time we reach .95 cents, dragging my stops up along the way to ensure the trade is all profit. I expect to let the remaining 25% ride after hitting .95 cents in hopes that it may jump up and above that ascending TL which would be uber bullish for this coin.
Entry - .7424
Target - about .95
SL - currently .60 (my stops are very loose)
RRR - 1.5 (better with tighter SLs of course)
This is not fin advice. I show you the way I trade for your education and entertainment only.
Stewdamus
