MTCUSD trade ideas


Will MATIC Price Float Above $0.60?
MATIC price has experienced a sharp 9.14% fall in market value.
The price has broken below the $0.60 mark, reverting from the resistance trendline.
A sudden increase in selling pressure caused MATIC to fall under the $0.65 mark, approaching $0.60.
Intraday trading volume spike intensified a 5.97% drop last night, followed by a 3.02% fall today, challenging the $0.60 support zone.
Technical indicators like MACD and RSI support the ongoing bearish trend, with no signs of a bullish crossover.
The solid bullish dominance at the $0.60 support zone might absorb the selling pressure, making it a potential entry spot for buyers.
A bullish reversal could lead MATIC to the 50-day EMA near $0.70, while a drop below $0.60 may test the psychological mark of $0.50.

Polygon MATIC/USD Long-Term TargetThe optimal scenario for Matic during the upcoming bull run involves me becoming a buyer at any price below $0.40.
Will This Wedge Breakout Boost MATIC Price By 20%?Wedge Breakout: MATIC price shows a bullish breakout from a falling wedge pattern, indicating potential growth.
24-Hour Jump: The Polygon coin price has increased by 4.54% in the last 24 hours.
20% Growth Projection: A bounce from $0.65 could lead to a 20% increase in MATIC coin price.
Rejection at $0.85: Extensive selling pressure at this price led to a falling wedge pattern and a 22.60% discount to $0.65.
Recovery from $0.65: MATIC price bottoms out at $0.65, marking a 4.78% recovery.
Bullish Reversal: A morning star pattern at $0.65 indicates a bullish reversal, potentially challenging resistance at $0.7160.
Positive Technical Indicators: MACD and RSI indicators support the recovery rally, with signs of a bullish crossover and uptick.
Potential Breakout Rally: Trapped momentum from the wedge pattern may fuel a rally, possibly breaking the $0.85 swing high.
Risk of Early Reversal: If MATIC prices fall below $0.65, the market value could drop by 7.39% to $0.60.


$MATIC scalpVery good Short entry here on CRYPTOCAP:MATIC , good risk to reward ratio, broke the weekly support here

MATIC/USDit's matic/usd chart (polygon)
matic dropped 80% on the local chart
i think 0.51 was last low, so i am buying on this levels ...
my target will be 1.16$
it is fib GP level.

MATIC Set For A New Price Dump?
Matic increase this place a solid support train line in action in the four-hour chart.
The recent correction under the influence of a new resistance trendline has resulted in a decline of 21% since 13 July.
These trendlines form a symmetrical triangle. Currently, the polygon prices are the support trendline after dropping below the crucial support level of 0.7160.
Additionally the selling pressure seems pretty evident with the ongoing correction phase and the rise in trading volume.
As per the EMAs, a potential death cross is seemingly inevitable. The RSI indicator is in the oversold zone projecting an extra bull cycle within the triangle before any decisive moves.
A bullish breakout can reach the $0.7990 swing high. However, a bearish breakdown will prove catastrophic for the polygon investors as the prices can dump by 13.76% to $0.60
At present, the price is within no-trade zone, and traders should wait for a decisive breakout.

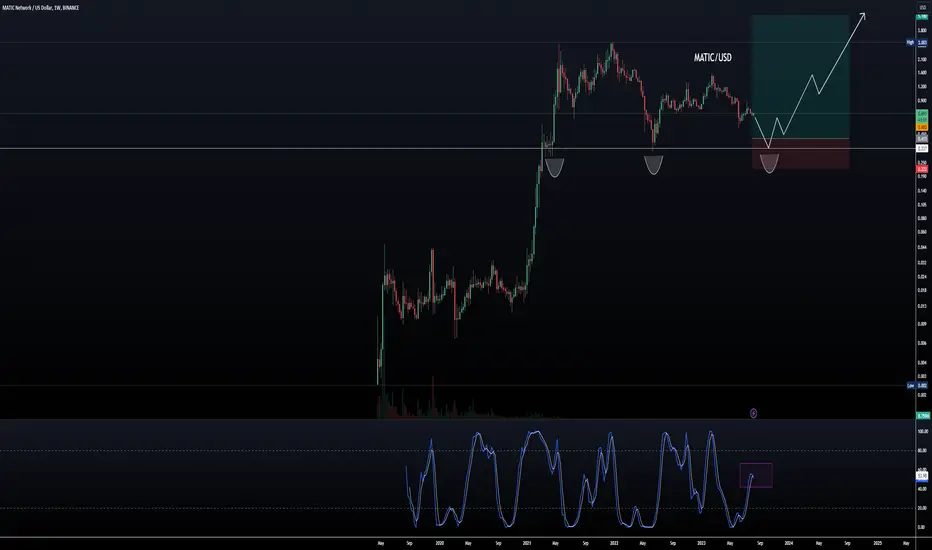
✴️ Polygon's (MATIC) Long-Term Target Mixed ($4.84 or $7.64)✔️ Let's start with the good news, the last 4 sessions MATICUSD closed green, that's an entire month growing... Great.
✔️ Higher highs and higher lows since June 2022, that's an entire year growing... Awesome.
The next All-Time High for this Altcoin is a bit mixed.
We got two numbers one being between $4-$5 and the other one being $7.6.
We are going with the latter one, this is a prediction for the next Cryptocurrency bull-market peak.
Polygon (MATICUSD) can hit around $7.6 or around 8X (800%+) growth from the current price.
This can obviously change and is not set in stone.
But that's my prediction for the long-term future.
Feel free to share yours.
Namaste.

MATIC showing a bearish continuation patternMATIC showing a bearish continuation pattern. 📉 Keeping a close eye on the daily and H1/H4 charts

#Crypto #Polygon - Trend is your frenMatic is setting a new recent high that was confirmed by RSI. It has just formed a nice bull flag.
Stochastic appears to be turning up.
All good news. Time to ride the trend with a short stop.
RSI for high was 70 so new high for RSI .
Slow STO is 53 so it has bottomed out above 50 which is a strong signal.
Volume was 14M on recent high and 4M on previous high.
Price is 0.773
Target 1 is 0.89
Stop loss at 0.71

✴️ Polygon With 6X Leverage (Experienced Traders/Adults Only)I am feeling kind of certain about the current condition of the Cryptocurrency market.
How about you, how are you feeling?
Leveraged trading is for experienced traders only or whomever wants to trade of course.
This is high risk and can result in liquidation and all money lost. If you don't know what you are doing, if you can't take a loss, please stay away.
With that said, let me show you my latest trade.
=========
LONG MATICUSDT
Leverage: 6X
Buy-in: $0.6500 - $0.6700
Targets:
1) $0.7410
2) $0.7800
3) $0.8700
4) $0.9620
5) $1.1111
6) $1.2300
7) $1.4750
8) $1.6500
Stop-loss: Close daily below $0.6300
Potential profits: 900%
Capital allocation: 3%
=========
Thank you for your continued support.
Namaste.

MATIC 7/3/23MATIC Depth chart on coinbase advanced shows the range? $0.65-0.75? I will get in around 0.6501 out around 0.7420 lol 14% move!

Fractal autoMATICaA.I running this chart must love fractally aesthetic B waves, just look at those B wave bits ...yummy ...
milk will flow like honey below .40
nfa
y axis only
dyor


Polygon is going to stay sideways and boring-Since 2021 if you have bought this coin and have not let go.. welcome to the sideways club because this coin has been on a rollercoaster of gains and declines inside this massive triangle that has formed. Triangle's can be very annoying if you do not like to trade them that is why we have angry emoji!!!! This coin should stay sideways for the coming future so if you are looking to get in at a price in this range you should be able too. I believe once this triangle is broke we should reach new Highs...


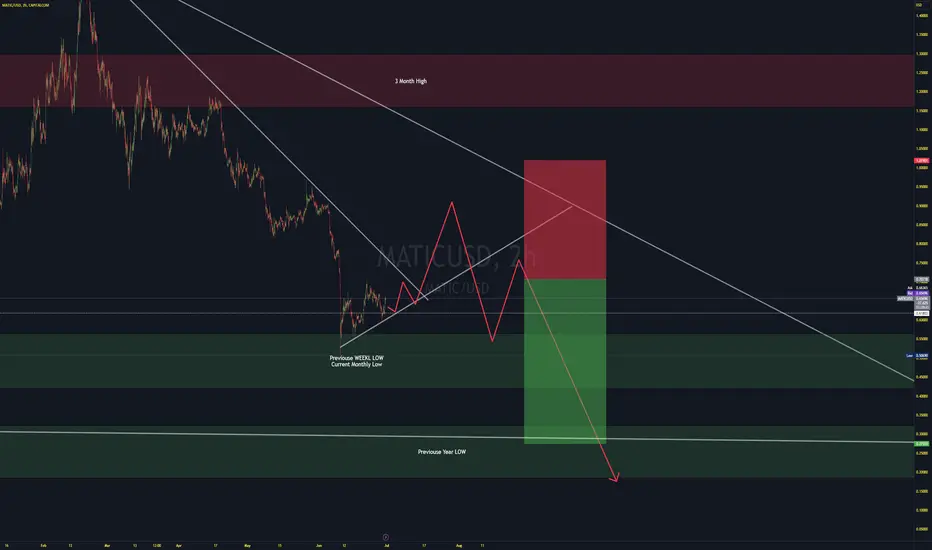
MATIC WILL NOT BREAKOUT UNTIL NEXT YEARa target of 3.3 to 5 for MATIC and a short term downside to 0.47
will not breakout until Dec 2024. Some ALTs will be sideways, until investors capitulate out of boredome. Liquidity will go somewhere. where else?? but to the Omega. -- XXX

Matic shortPolygon 2.0 architecture revealed, introduces unified liquidity & unlimited scalability
Formerly Matic Network, Polygon has seen attention lately, considering Securities and Exchange Commission clampdowns and platform delisting. Alongside other top alts, the SEC named MATIC as security in ongoing crypto regulation wave.
MATIC SHALL WE?Well looks like Matic is about to break the trend line very well
wait for the good break on the 1hr chart or 2hr chart, a retracement on 1hr or 30min chart and then we can long
Sl - 0.647
Tp 1 - 0.7
Tp 2 -0.78
tp 3 - 0.89

✴️ Polygon | One Of The Strongest AltcoinsMATICUSD is definitely one of the strongest Altcoins we've seen so far.
Even though this Altcoin project was mentioned in the SEC lawsuit, it remains trading within a higher low compared to last year and this at a much higher price, 50% higher than the June 2022 low.
And so we have a long-term higher low with a very strong long-term hidden bullish divergence on the RSI.
The hidden bullish divergence happens when the pair, MATICUSD in this case, produces a higher low yet the RSI produces a lower low.
Even though there can be additional correction short-term the probabilities favor the bulls.
This is going up regardless... If not within days, maximum weeks. That is what the chart is saying.
Namaste.
