Matic 1h chartthis is why we say all of the market is like a chain that BTC is they of the chain.
Matic chart is realy like the btc chart and its going to behave like BTC
if you want to take get short please be carefull and pay attention to your stop loss.
Follow for more and say your comment below the post
MTCUSD trade ideas

MTCUSD Cryptocurrency | Pivot Point | Channel Confirmations:
R1 (0.804); Channel Resistance; P (0.819); Horizontal Resistance

upper and lower bound range. LongSame model. Optimized pretty well now. As you can tell from the previous trades were starting to get a really good edge.

$MATIC has been old faithful for some time nowOf course $BNB is the mover :D
$MATIC still looks healthy - There is the issue of LONG TERM moving Avgs coming up
$XRP not moving but this has tendency to pop out of nowhere, really like that reversal
$DOGE outperforming $SHIB, IMO good call
#Crypto

MATICUSD H16: +40% gains BULLS the BEST level TO BUY/HOLDWhy get subbed to me on Tradingview?
-TOP author on TradingView
-2000+ ideas published
-15+ years experience in markets
-Professional chart break downs
-Supply/Demand Zones
-TD9 counts / combo review
-Key S/R levels
-No junk on my charts
-Frequent updates
-Covering FX/crypto/US stocks
-before/after analysis
-24/7 uptime so constant updates
🎁Please hit the like button and
🎁Leave a comment to support our team!
MATICUSD H16: +40% gains BULLS the BEST level TO BUY/HOLD(SL/TP)
IMPORTANT NOTE: speculative setup. do your own
due dill. use STOP LOSS. don't overleverage.
READ ENTIRE IDEA BEFORE EXECUTION!
🔸 Summary and potential trade setup
::: MATICUSD H16/candle chart review
::: accumulation in progress
::: bulls maintain control expect more gains
::: trading within well-defined range / accumulation
::: setup still valid as of RIGHT NOW
::: chart is LOG SCALE
::: get ready to BUY LOW later near range lows
::: currently/soon CORRECTION MODE
::: BUY LOW after pullback is over
::: entry - NEAR 72/74 CENTS
::: for now PULLBACK/CORRECTION MODE
::: use tight stop loss for this trade
::: 1.00 mirror S/R resistance overhead
::: potential re-test of mirror S/R at 1.00 USD
::: 72-74 cents decent bounce zone BULLS
::: potential HS setup BULLS bounce play
::: SPECULATIVE SETUP
::: do your own due dill
::: and use proper risk management
::: TP bulls is +40% gains
::: details: see chart
::: FINAL TP is +40% gains 1.00 USD
::: recommended strategy: BUY/HOLD after correction
::: TP BULLS +40% gains 1.00 USD final TP
::: SWING TRADE: BUY/HOLD IT
::: bull run not over yet
::: good luck traders!
::: BUY/HOLD and get paid. period.
🔸 Supply/Demand Zones
::: 72/74 cents demand
::: 1.00 usd fresh supply zone
🔸 Other noteworthy technicals/fundies
::: TD9 /Combo update: N/A
::: Sentiment mid-term: BULLS/40% gains
::: Sentiment short-term: CORRECTION/MODE
RISK DISCLAIMER:
Trading Crypto, Futures , Forex, CFDs and Stocks involves a risk of loss.
Please consider carefully if such trading is appropriate for you.
Past performance is not indicative of future results.
Always limit your leverage and use tight stop loss.

MTCUSD Target Price 0.8191Expect MTCUSD to reach price level 0.8191. I am targeting the top of parallel channel for take profit.

$MATIC still trading mid-70s to mid-90sAs the title states, matic has been trading between the mid 70s to the mid 90s. It had a brake lower one time and it had that huge pump a while ago above the '90s.
If you put $matic on a longer term time frame you will see why up move stopped.
Using daily is great for short-term pumps but if you use the longer-term charts, you'll see where the up swing will likely stop.
Once you see that the longer-term charts are no longer negative that's when you know we should keep pumping and daily charts will help you with resistance levels higher up and trading portions of them but this is when you begin to hodl. This is a process that takes a long time, especially if they are monthly charts.

Shiba & Doge & ADA & Matic Signals Signals for Shiba, Doge, ADA, and Matic.
Live Broadcast for educational purposes only.
Please enjoy and engage with one another.

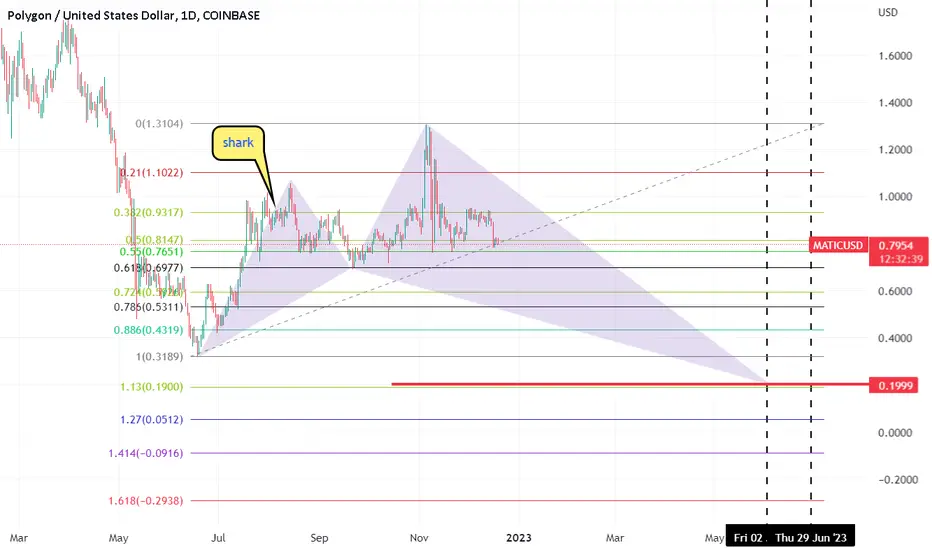
Matic target range 0,4 to 0,21 SharkMatic target range 0,4 to 0,21 Shark pattern area.
Matic downtrend has a target area with Shark pattern.

Matic (Polygon) Gem EditionPolygon believes in Web3 for all. Polygon is a decentralised Ethereum scaling platform that enables developers to build scalable user-friendly dApps with low transaction fees without ever sacrificing on security.
#Instagram launches NFTs on Polygon
#arrow-rightStripe launches global payouts with crypto using Polygon
Sadly correction is needed!

MATIC potential Buy and Sell DatesIf this pattern of Money flow repeats, potential Buy and Sell Dates are clear

Polygon MA200Interesting tests of the MA200 by MATIC. Watch to see which way it'll break, but looking back at the chart, the MA200 is like a magnet.

MATIC on a Head and Shoulders trying to avoid disasterThe Matic Network (MATICUSD) recently established trading below its 1D MA200 (orange trend-line), closing a daily candle below it for the first time since October 20. This alone is far from ideal for buyers but the price remains within the wide 0.690 - 0.770 Support Zone that is holding since July 26.
However, we can't ignore the Head and Shoulders pattern since October 13 that has just been completed. If broken to the downside, this has the potential to drop as low as the 1.5 Fibonacci extension, which is at 0.380 with potential Support levels before that at 0.525 and 0.420.
Until the Green Zone breaks though, the price can potentially rebound back to the 1D MA50 (blue trend-line) and the 0.970 overhead Resistance. The 1D ADX indicator seems to be in agreement. A closing above the 0.5 Fib at 1.000, invalidates the Head and Shoulders pattern completely and recovers the price towards 1.300.
-------------------------------------------------------------------------------
** Please LIKE 👍, SUBSCRIBE ✅, SHARE 🙌 and COMMENT ✍ if you enjoy this idea! Also share your ideas and charts in the comments section below! This is best way to keep it relevant, support me, keep the content here free and allow the idea to reach as many people as possible. **
-------------------------------------------------------------------------------
You may also TELL ME 🙋♀️🙋♂️ in the comments section which symbol you want me to analyze next and on which time-frame. The one with the most posts will be published tomorrow! 👏🎁
-------------------------------------------------------------------------------
💸💸💸💸💸💸
👇 👇 👇 👇 👇 👇

Liverpool x MATICshocker here, as soon as Liverpool sign a partnership with MATIC, the crypto suffers and 80% drop in asset value. that's what happens when you partner with a broken company owned by LeBron.

MATIC updateI can see 20 cent zone being the place of interest for the bottom of MATIC.. we have a shark pattern here potentially in play.

MATIC/USDT 1DAY UPDATE BY @CRYPTOSANDERSHello, welcome to this MATIC/USDT 1DAY chart update by CRYPTO SANDERS.
I have tried to bring the best possible outcome to this chart.
CHART ANALYSIS:-Polygon (MATIC) was another notable token to fall today, with prices also moving lower for a third straight day.
Following a high of $0.891 on Thursday, MATIC/USD dropped to a bottom of $0.8483 earlier in the day.
As a result of this drop, the polygon moved to its lowest point since November 30, when prices hit a bottom of $0.837
MATIC has since rebounded from earlier lows and is currently trading at $0.8569, which is still nearly 4% lower than Thursday’s floor.
This slight rebound comes as the RSI rejected a breakout of a point of support at the 43.00 level, and the index is currently at the 44.26 mark.
Historically, bulls have used this floor as a point of reentry, and should this reoccur, then we could see MATIC move back toward the $0.90 level.
This is not a piece of financial advice.
Hit the like button if you like it and share your charts in the comments section.
Thank you


MATICMatic bottoms around .20c IMO. The triangle/diagonal is very constructive & makes me think MSTIC can lead the next altseason 2023.
I've been charting this for many months now in my group & we are waiting for this juicy op. ;)

MATIC won´t be different. When to buy?Most likely Matic (Polygon) won´t be different. It will go down together with the whole crypto market.
On the chart you can see 2 possible scenarios. The direction is down.
Because of the FTX drama, the sentiment is bearish and probably it will remain bearish for awhile.
In the next days or weeks we may see more crypto firms announcing their bankruptcy therefore altcoins won´t perform well.
Welcome to crypto market!

Falling Wedge: Matic (Polygon)Similar to Monero, Matic is another cryptocurrency currently trending within a falling wedge bullish continuation pattern I've shared with my group. These are expected to rally to the upper Fibonacci extension targets at some point, though a tactical shakeout may occur first to weed out weak-handed retail traders. I'll jump in at the first breach of upper wedge resistance with demand volume confirmation, and vice-versa invalidate the swing if we pullback under support with predominance in supply. It's always better to be safe than sorry and live to experience the joy of the reversal! Good luck to everyone.
*Be sure to subscribe for more easy-to-follow charts with win ratios averaging between 80-85% in hitting the profit zones. I've been swing trading crypto fulltime since 2017 and handpick all the runners myself after conducting a series of careful volume-to-spread reads and Wyckoff schematic comparisons. Check out my past charts, see all the wins for yourself, then come join us!
**Not financial advice. Always DYOR and trade at your own risk.

MaticThe two areas of interest I am looking for $matic are circled. This shop fest is pointless to trade, you can get rekt with fees.

Matic BullishMatic oscillates up in four hours
There is a high probability that it is a rising relay pattern
Follow me and take you to achieve wealth freedom
