Institutional / Smart Money Vs Retail Psychology + Rules🎃 Many people approach technical analysis thinking that it is the first and most important thing to learn, which in reality should be the last. It is essential to first understand that trading psychology and risk management is the MOST IMPORTANT factor when trading within the market. Even if you have a strong technical analysis (which can never be perfect), you can still lose if you have poor risk management. You can lose even more if you are not patient enough and trade EMOTIONALLY.
🎃 The sad reality is that many professionals who have been trading for years still haven't realized this. I hope this little post will shed some light on advanced and novice traders. Every day I witness traders who make money and don't know why, or lose money and don't know why. One of the things I always like to advocate is that it is better to know why you lost a trade than not to know why you made money on a good trade. These are realistic expectations of the market, there is no simple magic spiral in technical analysis .
🧠 1.) Time frames: institutions (fund managers, funds, banks and whales) think in long time frames and monitor price action based on this (Years, Decades) small investors, retail traders monitor things in low time frames (Minutes, hours, days)
📜 Rule: always zoom out to higher time frame
🧠 2.) Objectivity: Small investors quickly switch between optimism and pessimism because of current price movements and news in the media. It can be a bull market one day and a bear market another day for a small investor. Institutional investors are not sentimental, they assess the growth rate of the market sector, the total market size available, the adoptation/acceptance, the growth of the network, the analysis of revenues (to predict profitability years and decades in advance). If an institutional investor reaches a conclusion, they hold it until the underlying financial situation changes.
📜 Rule: Follow the price not the news
🧠 3.) economic power: Small investors usually have limited money to invest, so they often resort to leverage, which typically results in full liquidity. Therefore small investors (who do not like to buy spot because it is not "cool") can easily be "thrown out" of trading because of the unlimited losses from leverage.
There is a reason why 90% of retail traders lose money.
Institutionalists brazenly exploit those with few resources and fear. Institutional investors have access to billions of dollars worth of resources and have teams of quantitative/statistical experts who control the automated trading algorithms.
📜 Rule: As long as you are not an expert, buy in Spot
🧠 4.) Influence: Institutional investors have deep pockets and can influence the general sentiment of the market through the press (news, social media and interviews). Institutional investors influence the news that small investors read. Institutionalists are well known for advertising higher prices for retailers to "buy at the top" to avoid FOMO (Fear of Missing Out). They are also notorious for creating tremendous market fear (FUD - Fear Uncertainty and Doubt), which encourages retailers to "sell at the bottom".
📜 Rule: You pay the price for FUD & FOMO!!
🧠 5.) Behavior: Institutions actively participate in futures, options and derivatives markets. Both actively benefit from short-term price cycles as well as longer-term accumulation strategies. Small investors tend to think in short time horizons. They are sophisticated, financially strong and have expertise. Institutions make money by attracting retail investors into the market (via FOMO) and then liquidating their positions (via FUD). In the market, one person's loss is another person's gain.
📜 Rule: News is usually wrong!
👉 Adoption stages
Many people misinterpret the exponential adoption process from a forward market perspective.
In short: You've probably heard the ingenious question that a scientist found that a lily started growing in a pond and doubled in size every day, then after 30 days covered 100% of the pond. Which day will it cover 50% of the lake?
The answer is on the 29th day, as it doubles in size every period. The lake goes from growing 50% to 100% when it doubles in size.
It is interesting to note that on day 28 the lake covered only 25% of the sample and on day 27 it covered 12.5%. It is therefore difficult to understand the exponential growth.
MTCUSD trade ideas

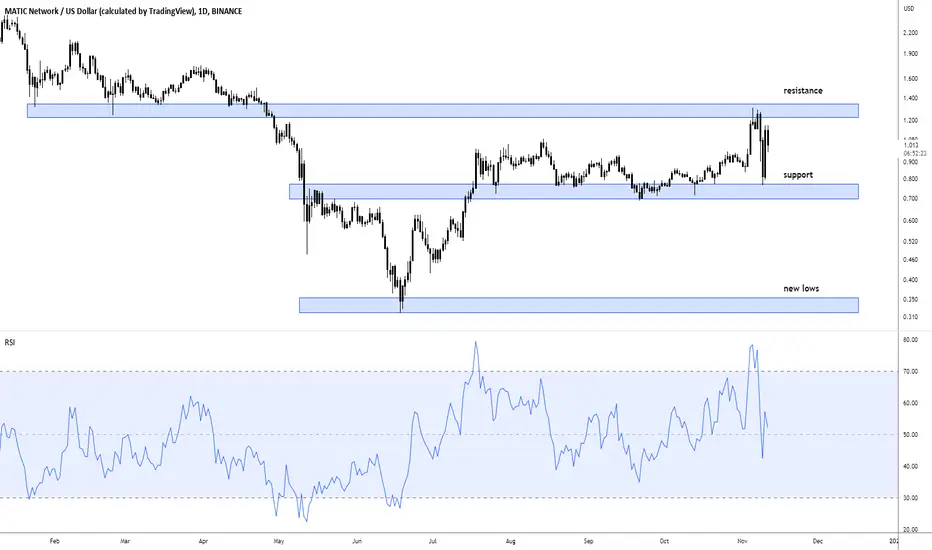
matic/usdMatic techniqual Analysis using fibs and volume profile. would not be bullish under resistance

MATIC failed to impulse
and also got stuck in a flag, because if it looks like a flag, it usually is one!
Break down the flag and its gonna get super ugly aka cheap!
Hold my beer pls
----
No financial advice, do your own research, don't be stupid

MATICUSD (4H) - Bullish reversalHi Traders
MATICUSD (4H Timeframe)
Waiting for the upward break of 0.890 resistance level, which will complete a bullish trend reversal pattern to go LONG. Only the downward break of 0.818 would cancel the bullish scenario.
Trade details
Entry: 0.890
Stop loss: 0.818
Take profit 1: 0.935
Take profit 2: 1.007
Score: 4
Strategy: Bullish reversal

MATIC: Opportunity to AccumulateMATIC back down at range support with re-emerging supply volume is a good indicator of further pullbacks. If it revitalizes and heads back up to TRM (range midpoint), beware of jumping back into another bull trap. Money can be made riding traps, but you better know when to get out. Let the supper supply block be a guidepost. Otherwise, count on more retracements, ultimately down to the 1.618% where the PA mitigates the previous low and thus zeros out that macro liquidity void. Be safe, be prosperous! Note: I uploaded an analysis vid on this very chart to YT. Check it out for a more thorough breakdown.
Do you like winning trades and making easy money? Be sure to SUBSCRIBE for more clean, accurate, easy-to-follow swing charts with exceptionally high win ratios (80-85% average)!
Not financial advice. Always DYOR and trade at your own risk.

Next entry for Polygon (MATIC)I believe that price could temporarily break out of the triangle and make a bear trap at the 0.5 ~ 0.382 Fibonacci retracement.
The MATIC token is one of those that appreciated above average considering this bear market.
The DMI SMI indicator also signals this possible opportune moment to buy

MATICUSD going Ethereum 2016/17 styleThe MATIC Network (MATICUSD) has been rejected last week on the 1W MA50 (blue trend-line). In an interesting turn of events, its price action since the COVID March 2020 crash, is similar to Ethereum's (ETHUSD) price action from October 2015 to January 2017, which also got rejected on its MA50 (for better illustration we used the 4D time-frame, even though 1W fares well too). Both made the MA50 rejection after the broke above their correction Lower Highs trend-line.
What made a big difference for ETH in its January 2017 break-out and rally was the bearish reversal on the U.S. Dollar (DXY). MATIC made its October 2022 bullish break-out as the DXY has pulled-back significantly. If the fractal continues to be repeated, expect a strong rally on MATIC in 2023.
-------------------------------------------------------------------------------
** Please LIKE 👍, SUBSCRIBE ✅, SHARE 🙌 and COMMENT ✍ if you enjoy this idea! Also share your ideas and charts in the comments section below! This is best way to keep it relevant, support me, keep the content here free and allow the idea to reach as many people as possible. **
-------------------------------------------------------------------------------
You may also TELL ME 🙋♀️🙋♂️ in the comments section which symbol you want me to analyze next and on which time-frame. The one with the most posts will be published tomorrow! 👏🎁
-------------------------------------------------------------------------------
👇 👇 👇 👇 👇 👇
💸💸💸💸💸💸
👇 👇 👇 👇 👇 👇

Matic lets goo to 1.66usd?hey hey
Please note: This is weekly a.,
so it may touch that SARS + little above, so 1.66 USDT and above might provide some R. Regardless of current situation in this crazy world Called crypto, or maybe because, it could, should or even must go first up.
So that is why:
10x longs
medium size
SL: 7%
TP: 1.16
lets see,
de


MATIC... MULTI TIME FRAME analysishello guys...
as you can see in chart... maticusdt have formed between two QML from daily and weekly time frame and i suppose to touch daily QML and then upward to reach weekly QML...
BUT if kink that i shown as gray area break down or be engulfed, this cryptocurrency drop a lot until next green area, I hope this not happened!
always do your own research.
If you have any questions, you can write it in comments below, and I will answer them.
And please don't forget to support this idea with your like and comment.

Potential upwards momentum Notice the Kijun-sen has pointed upwards while the Chikou-span has closed above its price 26 periods ago, if you drill down to the daily chart the price is above the cloud but the Kijun-sen points downwards, it's better to keep it in your watchlist to see how it unfolds in the coming days

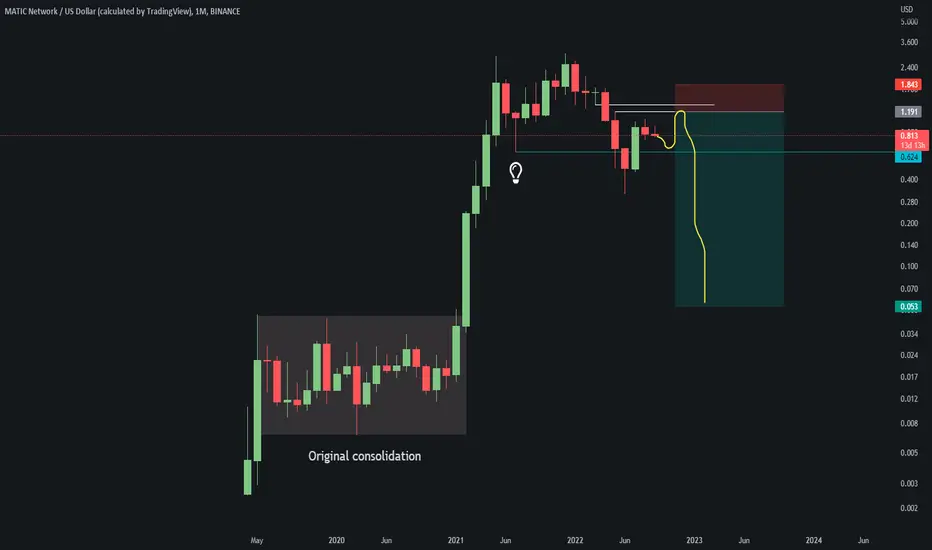
MATIC GIGA SHORT Hi guys, look what I have found.
I like this chart that's model is my model.
For the model to work i have to wait.
It's a monthly chart so we need to wait for few more month probably.
I'm sharing a biggest opportunity if you're a trade.
A BIG SHORT PROBABLY.
MATIC Potential WThis has a low chance of playing out, but if the market does go for one last shakeout, this would be something I'd look for.

MATIC - lower high After a bearish divergence and a lower high, even the strongest cryptos are under fire at these levels. Looking to see if a resistance zone can even be hit, but may put in the lower high as soon as today. Target is 30 cents.
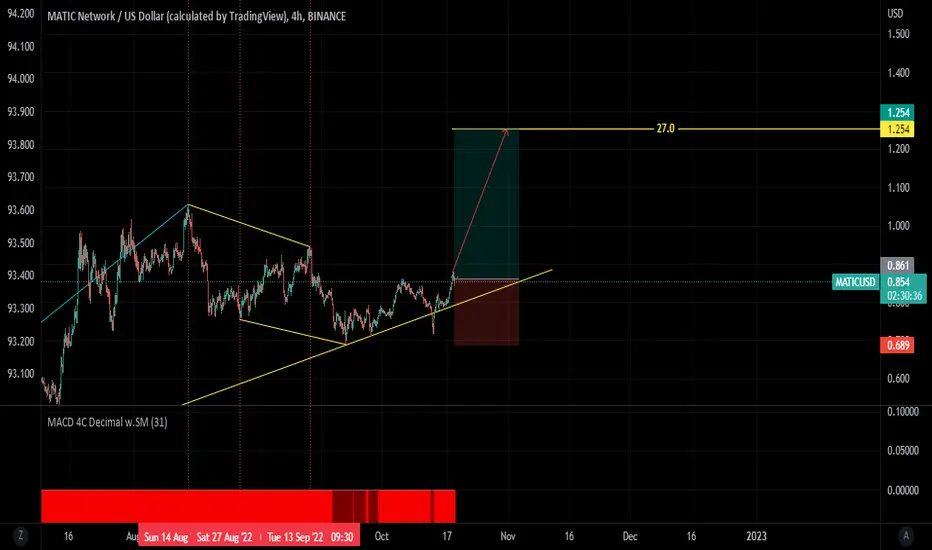
MATICUSD Profit to be made in range as well as break-outs.Polygon (MATICUSD) has been trading within a Channel Up since the June 18 bottom and on November 05 formed its latest Higher High. Since then, it has been highly volatile following the explosive mix of the FTX (bearish) and CPI (bullish) news. This should keep the price volatile and sideways mostly within the bottom (Higher Lows trend-line) of the Channel and the (dashed) Lower Highs trend-line, a sequence that took place from the previous August 14 High until October 17.
A break above the dashed Lower Highs would be bullish towards the 0.382 Fibonacci retracement level while further break, bullish towards the top (Higher Highs) of the Channel Up. Similarly, a break below the Channel Down would be bearish, targeting the previous dashed line.
-------------------------------------------------------------------------------
** Please LIKE 👍, SUBSCRIBE ✅, SHARE 🙌 and COMMENT ✍ if you enjoy this idea! Also share your ideas and charts in the comments section below! This is best way to keep it relevant, support me, keep the content here free and allow the idea to reach as many people as possible. **
-------------------------------------------------------------------------------
You may also TELL ME 🙋♀️🙋♂️ in the comments section which symbol you want me to analyze next and on which time-frame. The one with the most posts will be published tomorrow! 👏🎁
-------------------------------------------------------------------------------
👇 👇 👇 👇 👇 👇
💸💸💸💸💸💸
👇 👇 👇 👇 👇 👇

MA200 RetestKeep an eye out for the price interaction when MATIC retests the MA200. It could very well bounce off of it, or break through. Will revisit when there.


MATIC, wait for it...I am looking to SHORT MATIC above $1.18 (upper test) after one more high is created.
Distribution for MATIC here.
Good Luck

MATIC: One of the Strongest Alts in the Crypto MarketMATIC has held up quite well this year considering all that has happened in the markets. It's looking far more bullish than Bitcoin is, and it just broke out toward the upside of this channel. Polygon has established strong partnerships this year and I think it will do VERY well once the markets start looking more bullish.
$1.27 would be a nice TP zone if taps the 1.618 fib.

MATIC MATIC
We have seen crypto make a move to the upside recently but as it stands i think we can still see further downside.
Here we have MATIC which looks like it is in a ABC correction of wave 4 meaning we still have wave 5 to complete. It's reacting from a weekly supply zone with a refined daily supply inside.
For now i am only looking to sell
If we do move down again i will be looking for buys at the Weekly demand zone shown in the chart where there is Liquidity resting just above.
We can play shorts down to the weekly demand zone once the LTF starts creating bearish structure.
Remember stay neutral, don't get stuck to one bias, TRADE WHAT YOU SEE :)
Have a good weekend all :)

